Loading...
Loading...
Loading...
Loading...
Loading...
Loading...
Loading...
Loading...
Loading...
Loading...
Loading...
Loading...
Loading...
Loading...
Loading...
Loading...
Loading...
Loading...
Loading...
Loading...
Loading...
Loading...
Loading...
Loading...
Loading...
Loading...
Loading...
Loading...
Loading...
Loading...
Loading...
Loading...
Loading...
Loading...
Loading...
Loading...
Loading...
Loading...
Loading...
Loading...
Loading...
Loading...
Loading...
Loading...
Loading...
Loading...
Loading...
Loading...
Loading...
Loading...
Loading...
Loading...
Loading...
Loading...
Loading...
Loading...
Loading...
Loading...
Loading...
Loading...
Loading...
Loading...
Loading...
CalHHS programs are required to provide public reporting based on federal and California statute and regulations, court orders, and stipulated judgments, as well as by various funders. Although reporting may be mandated, unless the law expressly requires reporting of personal characteristics, publicly reported data must still be de-identified to protect against the release of identifying or personal information which may violate federal or state law.
Survey data, often collected for research purposes, are collected differently than administrative data and these differences should be considered in decisions about security, confidentiality and data release.
Administrative data sources (non-survey data) such as: vital statistics (e.g. births and deaths), healthcare administrative data (e.g. Medi-Cal utilization; hospital discharges), reportable disease surveillance data (e.g. measles cases) contain data for all persons in the population with the specific characteristic or other data elements of interest. Most of the discussions in this document pertain to these types of data.
On the other hand, surveys (e.g. the California Health Interview Study) are designed to take a sample of the population, and collect data on characteristics of persons in the sample, with the intent of generalizing to gain knowledge suggestive of the whole population.
The sampling methodology developed for any given survey is generally developed to maximize the sample size with the available resources while making the sample as un- biased (representative) as possible. These sampling procedures that are a fundamental part of surveys generally change the key considerations for protection of security and confidentiality. In particular, the main “population denominator” for strict confidentially considerations remains the whole target population, not the sampled population. But, if persons have special or external knowledge of the sampled populations (e.g. that a family member participated in the survey), further considerations may be required. Also, it is in the context of surveys that issues of statistical reliability often arise—which are distinct from confidentially issues, but often arise in related discussions.
Of particular note, small numbers (e.g. less than 11) of individuals reported in surveys do not generally lead to the same security/confidentiality concern as in population-wide data, and as such should be treated differently than is described within the Publication Scoring Criteria and elsewhere. In this case a level of de-identification occurs based on the sampling methodology itself.
The CalHHS Data Knowledge Base is composed of three main parts. These have historically been siloed documents, however, have now been published together to serve as a point of truth guide for all CalHHS data sharing needs.
As a product, the Knowledge Base is maintained by the Center for Data Insights and Innovation. It will be reviewed at least annually to ensure base functionality, such as no broken links, etc. For questions or contribution suggestions, please email [email protected]. Each section or component of the knowledge base will have it's own governance, update cycle, and contact information. Please see below.
The Data Sharing Guide was created in 2024 by the CalHHS Office of Technical Systems Integration (OTSI). The content of the previously published CalHHS Data Playbook and Data Playbook-Beta has been merged with this new sharing guide. If you have questions or ideas to contribute to the Data Sharing Guidebook section, please email .
The Numerator – Denominator Condition represents a combination of both the Numerator Condition and Denominator Condition and for which both conditions must be met or else a more detailed assessment is required. This may be considered as an initial screening of a data set.
The Numerator Condition sets a lower limit for the cell size of cells displayed in a table. The DDG has set this limit as any value representing aggregated or summarized records which are derived from less than 11 individuals (clients). Of note, values of zero (0) are typically shown since a non-event cannot be identified.
The Denominator Condition sets a minimum value for the denominator. The DDG has identified the lower limit for the denominator to be a minimum value of 20,000.
Since this is a Numerator – Denominator Condition, both the minimum cell size for the numerator and denominator must be met. If these conditions are met, the table can move to Step 5 for consideration for release to the public. If either the numerator of denominator condition is not met, then the review of the data must proceed to Step 3.
Necessity of criteria for this step will be determined by each department. This may vary depending on the purpose of the release and whether or not the department or program is a HIPAA covered entity or not. See for further discussion.
This step requires the use of a documented method to assess the risk that small numerators or small denominators may result in conditions that put individuals at risk of being re-identified.
Assessment of potential risk for a given data set must take into account a range of contributing considerations. This includes understanding particular characteristics of a given data set that is being released. For example, if the potential values for a specific personal characteristic, such as race, results in many small numbers in data set A but does not in data set B, then the risk may be low for data set B and high for data A if the groupings of the personal characteristics include the same categories. For this reason, each department or program may set different values for risk based on the underlying distribution of these variables in the data sets of interest.
There are many methods used to assess potential risk. Many of the methods that are in use throughout the country are described in the various references provided in Section 15. While each department will document the method(s) chosen for use, the following description of the Publication Scoring Criteria is provided as an example and may be adopted by departments as a method to assess potential risk.
CalHHS implemented an agency-wide governance structure in October, 2014. The governance structure acts both in a decision-making and advisory capacity to Agency leadership and its departments and offices. Implementation of the governance framework supports information technology (IT) initiatives that are more tightly aligned with meeting business objectives, enhanced project prioritization and improved strategic IT investment decisions. The Executive Sponsor is the Undersecretary of CalHHS. The Advisory Council consists of representatives of senior leadership from departments and offices in the Agency. There are five subcommittees that report to the Advisory Council, which include the Portfolio, Procurement, Infrastructure, Risk Management and Data Subcommittees. The Data De-identification Workgroup was convened by the Data Subcommittee with representation from all departments and offices in CalHHS.
CalHHS is engaged in improving transparency and public reporting through the Open Data Portal. As described in the CalHHS Open Data Portal Handbook, not all data is suitable for use on the open data portal. Data is Publishable State Data if it meets one of the following criteria:
Data that are public by law such as via the or
As described in and Figure 2, personal characteristics of individuals introduce the most significant risk with respect to identifying individuals in a data set. The following are examples of personal characteristics.
Identifiers as defined in CA IPA
Identifiers as defined in HIPAA
Demographics typically reported in census and other reporting
The CalOHII is authorized by state statute to coordinate and monitor HIPAA compliance by all California State entities within the executive branch of government covered or impacted by HIPAA. To help ensure full compliance with HIPAA, CalOHII conducted a reassessment with all State Departments in January 2014 and updated as of July 27, 2015. The following are the self-reported results of this reassessment:
The Publication Scoring Criteria is used to identify the presence of small values that are considered sensitive in order to facilitate the assessment of potential risk. The Publication Scoring Criteria combines a number of conditions that increase the risk of a given data table and allows the department to evaluate those risks in combination with each other. The variables included in the Publication Scoring Criteria are those variables routinely used to publish data but are not all inclusive.
A variable is a symbol representing an unknown numerical or categorical value in an equation or table. A given variable may have different ranges assigned to it. Ranges assigned to the variable may be defined many ways which may increase or decrease the risk of identification of an individual represented in the table. This is seen in the Publication Scoring Criteria in that ranges for variables which will produce smaller groupings have a higher score.
The Publication Scoring Criteria in Figure 6 quantifies with a score two identification risks: size of potential population and variable specificity. The Publication Scoring Criteria is used to assess the need to perform statistical masking as a result of a small numerator, small denominator, or both. The Publication Scoring Criteria takes into account both variables associated with numerators, such as Events, and with denominators, such as Geography.
This method requires a score less than or equal to 12 for the data table to be released without additional masking of the data. Any score over 12 will require the use of statistical masking methods described in Section 4.4 or documentation regarding the specific characteristics of the data set that mitigate the risk.
When identifying the score for each variable, use the highest scoring criteria. For example if a table had age groups of 0 to 11 years, 12 to 14 years, and 15 to 18 years then the score for the “age range” variable would be +5 because the smallest age range is 12 to 14, which is an age range of three years.
If a variable has greater granularity than the score listed, use the highest score listed. For example, if the variable “Time” has a frequency of “weekly” then the score would be +5 which is the maximum score associated with the most granular level (monthly) of the variable in the Publication Scoring Criteria.
In addition to assessing the granularity of each variable, the interaction of the variables is also important. As discussed later in section 6.4, decreasing the granularity or the number of variables are both techniques for increasing the values for the numerators. The final criteria in Figure 6 is that for Variable Interactions. This provides for a subtraction of points if the only variables presented are the events (numerator), time and geography and an addition of points for including more variables in a given presentation. With respect to the subtraction of points, the score is based on the minimum value for the Events variable. For example, if the smallest value for the Events is 5 or more, then the score would be -5. However, if the smallest value for the Events is 2, then the score would be 0. This is discussed in more detail in Section 6.2: Assessing Potential Risk - Publication Scoring Criteria.
In assessing risk, the scoring can be part of the justification to release or not release data but should not by itself be an absolute gateway to the release data. The review must take into account additional considerations including those that are discussed in this document in addition to the scoring.
Data shall not be released if it is restricted due to the HIPAA, state or federal law. Data tables may fall into one of three categories:
Level One: Data tables that can be released to the public and published without restriction;
Level Two: Data tables that have some level of restriction or sensitivity but currently can be made available to interested parties with a signed data use agreement; or
Level Three: Level three data are restricted due to HIPAA, state or federal law. These data will NOT be accessible through the CalHHS Open Data Portal.
Data can change from being Level 3 to Level 1 if appropriate de-identification processes are employed. The CalHHS DDG described in this document will support departments and offices in the evaluation of data to determine whether it has been adequately de-identified so that it can be considered Level 1.
Race
Ethnicity
Language Spoken
Sex
Age
Socio-economic status as percent of poverty
Personal characteristics are those characteristics that are distinctive to a person and may be used to describe that person. Personal characteristics include a broader set of information than those data elements that may be specifically defined as identifiers (such as, driver license, address, birth date, etc.). Personal characteristics may also be inferred from characteristics related to provider or utilization data. For example, if presented with information about a provider that only sees women, it can be inferred that the clients are women even if that is not specifically stated in the data presentation.
The Data De-Identification Guide published here is the current approved CalHHS Agency De-Identification Guidelines. Each Department or Office within CalHHS can also publish their own version of the DDG. The refresh cycle of the Agency DDG is determined by the CalHHS DDG Peer Review Team (PRT.) As of January 2025, the PRT is currently developing an update to the Agency DDG with publication date TBD.
If you have questions about the governance around the Agency Data De-Identification Guidelines please visit the DDG Governance page.
If you need Department specific Data De-Identification Guidelines, or other Department specific data information, please contact that Department directly. This page on the CHHS website has links to each of the CalHHS Department and Office webpages.
The Open Data handbook is a resource with its audience being the CalHHS ODP+GIS Workgroup and those that publish or utilize the CalHHS Open Data Portal. As of February 2025, revisions are being made to the ODP handbook. Please see the ODP Governance page for more information. If you have questions or ideas to contribute to the Open Data section, email [email protected].


Many CalHHS programs oversee, license, accredit or certify various businesses, providers, facilities and service locations. As such, the programs report on various metrics, including characteristics of the entity and the services provided by the entity.
Characteristics of the entity are typically public information, such as location, type of service provided, type of license and the license status.
Services provided by the entity will typically need to be assessed to see if the reporting includes personal characteristics about the individuals receiving the services. Several examples are shown below.
Reporting number of cases of mental illness treated by each facility – if the facility is a general acute care facility then the reporting of the number of cases does not tell you about the individuals receiving the services.
Reporting number of cases of mental illness treated by each facility – if the facility is a children’s hospital then the reporting of the number of cases does tell you about the individuals receiving the services.
Reporting number of psychotropic medications prescribed by a general psychiatrist does not tell you about the patients receiving the medications.
Reporting number of psychotropic medications prescribed by a general psychiatrist to include the number of medications prescribed by the age group, sex or race/ethnicity of the patients receiving the medications does tell you about the patients receiving the medications.
In (a) and (c) above, assessment for de-identification is not necessary as there are no characteristics about the individuals receiving the services. However, in (b) and (d) above, the inclusion of personal characteristics which may be quasi-identifiers, especially when combined with the geographical information about the provider, does require an assessment for de-identification.
Taking the time to plan your project is essential. Whether you’re managing a team, analyzing or cleaning a portion of data, or drawing conclusions from your findings, completing any portion of the project requires a great deal of thought and planning. In the following section, we’ll provide a clear, step-by-step guide to the entire planning process, including everything you need to know about creating goals, determining a plan, and getting your data. It is our hope that you leave this section with a detailed and specific plan, and the confidence that you have the tools to carry out a successful project.
Be sure that you are measuring success and thinking critically about what your success metrics will be. You must have clear and actionable goals that you want to achieve with your data project.
Everyone is going to define data differently. Start by understanding what data means for your Department. It also will be important for you to prioritize your data. You must know which data are the highest value to your organization.
You’re going to want to be sure to start small. Running a few pilots around data can’t hurt; this will help you get a better understanding of the lay of the land, what you can improve with data, and how you can identify the gaps.
Every employee will need different kinds of accessibility, so make sure that your data systems maps to these needs and is not providing unauthorized access to information.
This will help staff clearly see the impact of the project and how data can improve effectiveness and efficiency. Including the Playbook in a new employee orientation could further enable staff and foster a culture of data within a Department.
Don’t have access to the IT services you need? Maybe there is a shared service you can use with other Departments, or there are easier ways to get access to contemporary technologies. It’s also possible that you could iteratively re-engineer your existing IT infrastructure to gradually meet emerging needs.
After completion of the statistical de-identification process, each department will specify the additional review steps necessary for public release of various data products. Products may include but are not limited to reports, presentation, tables, PRA responses, media responses and legislative responses. See Section 7: Approval Process for further discussion.
CalOHII......... California Office of Health Information Integrity
CDC.............. Centers for Disease Control and Prevention
CDPH........... California Department of Public Health
CDSS............ Department of Social Services
CHHS........... California Health and Human Services Agency
CMS.............. Centers for Medicare and Medicaid Services
CPHS............ Committee for the Protection of Human Subjects
DDG.............. Data De-Identification Guidelines
DHCS........... Department of Health Care Services
HIPAA........... Health Insurance Portability and Accountability Act
IPA................. Information Practices Act
MHSOAC..... Mental Health Services Oversight and Accountability Commission
OSHPD......... Office of Statewide Health Planning and Development
PAR-DBR..... Public Aggregate Reporting - DHCS Business Reports
PHI................ Protected Health Information
PI................... Personal Information
PRA............... Public Records Act
PRT............... Peer Review Team
Governance for DDG will be provided by the Data Subcommittee with support from the Risk Management Subcommittee. The Subcommittees are part of the CHHS governance structure as described in the CalHHS Information Strategic Plan. Governance for the CalHHS DDG will provide the following support for departments and offices.
Maintain the CalHHS DDG, which will include updates and revisions to the document as well as annual reviews for currency.
Coordinate integration of the CalHHS DDG into the Statewide Health Information Policy Manual (SHIPM), Section 2.5.0 De-identification and the CalHHS Open Data Handbook.
Convene a Peer Review Team (PRT).
Provide for escalation of issues that cannot be resolved by the PRT.
The CalHHS PRT will include no more than two representatives from each department or office. Membership of the PRT is expected to include individuals with the following background and experience.
Knowledge of and experience with generally accepted statistical and scientific principles and methods for rendering information not individually identifiable.
Knowledge of and experience with legal principles associated with data de-identification in compliance with California IPA and HIPAA.
The PRT will have the following responsibilities:
Provide review and consultation regarding a department’s DDG to ensure it is consistent with the CalHHS DDG. This may be particularly useful if a department incorporates methods for de-identification in the department’s DDG that have not already been documented in the CalHHS DDG.
Provide for escalation and review of data de-identification questions or issues that a department is not comfortable resolving independently.
Develop training tools to be used by departments when developing and implementing department specific DDGs based on the content of the CalHHS DDG.
The PRT will not review all disclosures or data released by each department.
Aggregate – formed or calculated by the combination of many separate units or items (Oxford Dictionary).
De-identified – generally defined under the HIPAA Privacy Rule (45 CFR section 164.514) as information (1) that does not identify the individual and (2) for which there is no reasonable basis to believe the individual can be identified from it.
Denominator – the portion of the overall population being referenced in a table or a figure representing the total population in terms of which statistical values are expressed (Oxford Dictionary).
Numerator – the number of specific cases as identified by the variable from a given population or the number above the line in a common fraction showing how many of the parts indicated by the denominator are taken (Oxford Dictionary).
Protected Health Information – information which relates to the individual’s past, present, or future physical or mental health or condition, the provision of health care to the individual, or the past, present, or future payment for the provision of health care to the individual, and that identifies the individual, or for which there is a reasonable basis to believe can be used to identify the individual (HIPAA, 45 CFR section 160.103).
Personal Information – includes information that is maintained by an agency which identifies or describes an individual, including his or her name, social security number, physical description, home address, home telephone number, education, financial matters, email address and medical or employment history. It includes statements made by, or attributed to, the individual (California Civil Code section 1798.3).
Publishable State Data – Data is Publishable State Data if it meets one of the following criteria: (1) data that are public by law such as via the PRA or (2) the data are not prohibited from being released by any laws, regulations, policies, rules, rights, court order, or any other restriction. Data shall not be released if it is highly restricted due to the Health Insurance Portability and Accountability Act (HIPAA), state or federal law (such data are defined as Level 3 later in this handbook.)
Re-Identified – matching de-identified, or anonymized, personal information back to the individual.
The following list of variables is important to consider when preparing data for release.
Age
Sex
Race
Ethnicity
Language Spoken
Location of Residence
Education Status
Financial Status
Number of events
Location of event
Time period of event
Provider of event
As stated previously, variables that are personal characteristics may be used to determine a person’s identity or attributes. When these characteristics are used to confirm the identity of an individual in a publicly released data set, then a disclosure of an individual’s information has occurred. Individual uniqueness in the released data and in the population is a quality that helps distinguish one person from another and is directly related to re-identification of individuals in aggregate data. Disclosure risk is a concern when released data reveal characteristics that are unique in both the released data and in the underlying population. The risk of re-identifying an individual or group of individuals increases when unique or rare characteristics are “highly visible”, or otherwise available without any special or privileged knowledge. Unique or rare personal characteristics (e.g., height above 7 feet) or information that isolate individuals to small demographic subgroups (e.g., American Indian Tribal membership) increase the likelihood that someone can correctly attribute information in the released data to an individual or group of individuals.
Variables that are event characteristics are often associated with publicly available information.
Therefore, increased risk occurs when personal characteristics are combined with enough granularity with event characteristics. One could argue that if no more than two personal characteristics are combined with event characteristics then the risk will be low independent of the granularity of the variables. This hypothesis will need to be tested using various population frequencies to quantify the uniqueness of the combination of variables both the in the potential data to be released as well as in the underlying population.
Revision history for CalHHS Agency Data Sharing Guidelines
The Data Sharing Guidelines published here is a combination of the previously published CHHS Data Playbook, Data Playbook Beta, and the newly produced Data Sharing Guidelines from OTSI/CDII. The current version of the Data Sharing Guidebook is 1.0.
Data is a core facilitator for the California Health and Human Services (CalHHS) vision of:
“… a connected network of state, local, and community providers, an ecosystem of coordinated services, and the secure, appropriate use of comprehensive demographic, socioeconomic, encounter, and outcomes data to generate insights that drive equitable policies, programs, and service delivery.” – CalHHS IT & Data Strategic Plan, March 2024
With over 33,000 employees, we at CHHS make up the largest agency under California’s executive branch. Our 13 departments collectively have access to an unprecedented amount of data -- it is our mission to use this data to improve the programs and services we deliver to our clients, amplify the impact of the data reports we create, and to create an organizational culture that is focused on data-driven decision making.
Realizing this vision requires data flow across the Agency’s departments and partner organizations. The CalHHS Data-Sharing Guidebook’s purpose is to be an asset that is broadly applicable to departments with various levels of data-sharing capabilities and experience. The diagram below provides the CalHHS Data-Sharing Guidebook’s purpose in California’s data- sharing ecosystem.
The Guide is composed of two sections:
The Business Use Case Proposal Lessons Learned summarizes the learnings from data-sharing experts who participated in the discovery sessions used to create this Guide.
The Data-Sharing Plays provide how-to guidance to implement capabilities that help establish data-sharing agreements and deliver meaningful data.
The Guide is a supplement to existing data-sharing assets, including:
State of California
The CalHHS
Department-level data-sharing assets
The Guidebook is shared with you and your Department so you can use its content to supplement existing department data-sharing processes and training materials.
The Guidebook’s primary audience is data coordinators and data management teams that create data-sharing agreements, fulfill data requests, and consume shared data. The Guidebook’s Data-Sharing Plays also benefit your department’s data analyst, application development and security teams.
If not already in place, we recommend creating a centralized department-level repository of BUCPs and mechanisms to track data-sharing metrics. Your previous BUCPs are valuable assets. Create a centralized department-level document repository for your BUCP artifacts to:
Establish a library of reusable BUCP content to reduce content creation time.
Maintain templates such as standard security controls and forms required by your department.
Store reference material such as resolutions to disputes and solutions to statutory restrictions for data-sharing.
Store quantitative and qualitative information on data-sharing outcomes to include in business cases to invest in data-sharing.
A departmental-level view of all BUCPs also helps prioritize the data-sharing improvement efforts by identifying frequently requested datasets.
Your BUCP document repository can also be a resource for lessons learned as BUCPs are approved and fulfilled. Collect team input to create “lessons learned” that you gleaned from working through the BUCP process. Retrospectives are an effective way to engage your team to collect and document lessons learned. Feel free to use the CalHHS Data-Sharing Guide: Lessons Learned section as a starting point for your department’s lessons learned.
Make sure your data-sharing team is aware of your department’s lessons learned as they develop. You can also review the lessons learned during BUCP kickoff efforts or as challenges arise during approval and data fulfillment. Other departments can benefit from your experience as well to apply or tweak them for their purposes. Please share them with other departments through CalHHS data-focused subcommittees and workgroups.
We recommend conducting a discovery session with your data-sharing team and relevant stakeholders to identify the BUCP-related metrics for tracking and reporting. Some examples of data points you may want to include in your BUCP tracking process are provided in the table below:
Once you have your metrics and data points identified, create a mechanism to collect them in your data-sharing tracking system.
You should check with your department’s technology and enterprise architecture teams to identify platforms for your BUCP tracking system. Also, consult with your department’s information security team to identify any required security controls for your BUCP repository. Your selected platform for BUCP tracking should include the following capabilities:
Document repository to store BUCP’s and related documents.
Capabilities to identify and retrieve BUCPs and other documents.
Mechanism to track BUCP status and metrics.
Task tracking to coordinate BUCP fulfillment activities.
Make sure your BUCP document repository is secured with access control to safeguard sensitive information including the contents of the Specialized Security and Specialized Privacy BUCP field content.
The State of California’s Office 365 (O365) provides tools to create a BUCP tracking mechanism using Excel and Microsoft Teams.
Technology standards for metadata differ between Application Program Interfaces (API's) and data stored in databases or files. The techniques provided in the Guide to identify and describe data elements are pertinent to describing your APIs. If your data-sharing improvement effort is API- focused, reference this section during the execution of Play 5: Establish Your Metadata Repository to establish a repository compatible with API metadata standards.
Industry standards and best practices will evolve with the field. Currently, there are two widely adopted API description standards:
(OAS) is a broadly recognized metadata specification for API descriptions.
(RAML) is an API modeling language for developing and publishing API descriptions.
Which one should you use? Each option has its considerations.
If your application development team has already adopted an API description standard, leverage their work and adopt the same standard. If your API descriptions are not current, execute Plays 2 through 6 to make them current.
If an API specification standard is not already in place, you need to work with your application development and enterprise architecture teams to jointly select a standard.
A primary consideration is which standards are supported by your API Gateway/Management platform. Review your platform’s documentation to identify supported standards. Converters are available to change formats between OAS and RAML; however, this adds an additional step to your deployment process.
Another critical factor is each standard's approach to capturing custom metadata that is beneficial for data sharing, such as security classifications and statute citations. OAS 3.x provides embedded in the description file. RAML extends its base metadata elements with Your development team should evaluate each option to determine which platform’s approach to custom metadata best aligns with their processes.
For your API descriptors to be useful, they must be easily accessible by API consumers. Check if your API Gateway/Management platform provides an API catalog to publish your APIs. If this feature is available, it is the best option as it easily integrates publishing your API descriptors into your development and deployment processes.
If your platform does not provide an API catalog, you can make your API descriptors accessible using a web server or an object store (e.g., AWS S3, Azure Blob Storage). OAS and RAML publish descriptors as JSON files that are viewable using a web browser. Your team will need to create and maintain an index webpage that contains links to your API descriptions. Be sure to include steps to publish the API descriptor and update the index webpage in your development processes.
Many data catalog platforms maintain the JSON-based formats used by both OAS and RAML, creating an option for publishing your APIs for data consumers. Using a data catalog also allows custom metadata to be captured if using extensions/overlays is not an option. Using a data catalog also provides the benefit of establishing data lineage from APIs to backend databases.
The approach described in Play 6.3: Keep Your Metadata Repository Current that integrates metadata maintenance into your development process applies to maintaining your API descriptions. RAML combines the creation of API descriptions with modeling and development. OAS generates descriptions from the underlying application code used to develop the API. Both options create a closed loop between development and descriptors to keep your API catalog current.
Your department and its staff invested in data-sharing improvements by completing the previous Plays. It’s time to put your data into use internally within your department and externally with other organizations.
This Play provides ideas about how to communicate the available data for sharing so that your department yields benefits from data-sharing improvements. Promoting data awareness and consumption is important to justify future data-sharing investments and creates a sense of accomplishment for the team that helped the Plays.
As previously noted, data-sharing improvements aren’t just for the benefit of data-requesting organizations. Your internal department teams benefit from the metadata you collected in . The Guidebook’s supplemental section, Benefits to Your Department from Executing the Plays, describes the benefits of executing the Plays. You can use this supplemental section to identify teams within your department and notify them of the enriched metadata and artifacts created in Play 6. Examples of stakeholders who may benefit from your team’s work include:
Data Analytics
Application and Data Management
Information Security
Departmental Programs
The first step is identifying internal stakeholders and teams benefitting from your data-sharing improvements. The supplement helps you identify internal analytics, technical, and security teams that benefit from your enhanced metadata repository. The notes on the department’s datasets collected in may identify programs that frequently share data within your department.
Start your data awareness campaign by emailing relevant stakeholders to notify them of the improved datasets and their benefits. Be sure to use terms that are relatable to your target audience. For example, using the term “data descriptions” is more easily understood than “metadata.” You can also schedule a Lunch and Learn or online meeting to review the benefits and how to use your metadata repository. This creates an opportunity for rich discussion about the data, how it is used, and ideas for future improvements.
Track the benefits and their impacts as your improved dataset is consumed by internal stakeholders. You can supplement your BUCP tracking repository with internal benefits to help justify investment in future data-sharing efforts.
Be sure to notify interested internal stakeholders as you incrementally improve data-sharing for new datasets.
This Play provides ideas for promoting awareness of the enhanced dataset with other CalHHS departments. A great way to promote data awareness is through the CalHHS Data Subcommittee and Data Coordinators workgroup. Participants in these groups can help spread the word about data to interested stakeholders within their departments.
The CalHHS Open Data Portal’s s a tool to identify datasets. To contribute to the open data catalog and promote awareness of your datasets, create a de-identified dataset for publication in the .
If you have datasets that other departments and organizations frequently request, publishing data-sharing information on your website is beneficial. The Department of Health Care Access and Information (HCAI) website is an example of a site that helps promote data awareness and data requestors’ understanding of data-sharing requirements.
Budget reporting may include both actuals and projected amounts. Projected amounts, although developed with models that are based on the historical actuals, reflect activities that have not yet occurred and, therefore, do not require an assessment for de-identification. Actual amounts do need to be assessed for de-identification. When the budgets reflect caseloads, but do not include personal characteristics of the individuals in the caseloads, then the budgets are reflecting data in the Providers and Health and Service Utilization Data circles of the Figure 2 Venn Diagram and do not need further assessment. However, if the actual amounts report caseloads based on personal characteristics, such as age, sex, race or ethnicity, then the budget reporting needs to be assessed for de-identification.
Many CalHHS programs oversee, license, accredit or certify various businesses, providers, facilities and service locations. As such, the programs report on various metrics, including characteristics of the entity and the services provided by the entity.
Characteristics of the entity are typically public information, such as location, type of service provided, type of license and the license status.
Services provided by the entity will typically need to be assessed to see if the reporting includes personal characteristics about the individuals receiving the services. Several examples are shown below.
Reporting number of cases of mental illness treated by each facility – if the facility is a general acute care facility then the reporting of the number of cases does not tell you about the individuals receiving the services.
Reporting number of cases of mental illness treated by each facility – if the facility is a children’s hospital then the reporting of the number of cases does tell you about the individuals receiving the services.
In (a) and (c) above, assessment for de-identification is not necessary as there are no characteristics about the individuals receiving the services. However, in (b) and (d) above, the inclusion of personal characteristics which may be quasi-identifiers, especially when combined with the geographical information about the provider, does require an assessment for de-identification.
CalHHS programs are required to provide public reporting based on federal and California statute and regulations, court orders, and stipulated judgments, as well as by various funders. Although reporting may be mandated, unless the law expressly requires reporting of personal characteristics, publicly reported data must still be de-identified to protect against the release of identifying or personal information which may violate federal or state law.
Driving towards continuous process improvement.
This is an important step as it will help us validate outcomes and determine successes. It also will help identify lessons learned, which will grow our toolbox and provide us with better intelligence. This ultimately will allow us to generate new content and additional best practices to help other Departments across the Agency.
Assess the processes involved in organizing and/or implementing the project. The focus here is on evaluating organizational and project capabilities rather than results.
Assess short term objectives, which suggest that your larger goals are being achieved. Impact evaluations are much easier to measure because they consider benefits in terms of changes in beliefs and attitudes, skills, behavior and/or policies, structures and systems.
Assess how effective you have been in meeting big picture goals. The difficulties associated with outcome evaluations include: attributing change to any one particular project; long periods between the project and being able to see change; and finding reliable and valid ways of gathering this type of information.
Establishing an evaluation process will ensure that the benefits anticipated by the implementation of any particular program or policy change are realized and an assessment can be made of the project’s overall success.
What are the lessons learned? How will you iterate on the current solution? What are the next steps?
Action Item: Continuously measure success; think critically about what your success metrics should be.
The California Health and Human Services (CalHHS) Open Data Handbook provides guidelines to identify, review, prioritize and prepare publishable CalHHS data for access by the public via the and – with a foundational emphasis on value, quality, data and metadata standards, and governance. This handbook is meant to serve as an internal resource and is also freely offered to any party that may be interested in improving the general public’s online access to data and to provide an understanding of the processes by which CalHHS makes its publishable data tables available. The handbook focuses on general guidelines and thoughtful processes but also provides linked tools/resources that operationalize those processes. The CalHHS Open Data Handbook is based on and builds upon the New York State Open Data Handbook, and we would like to acknowledge and thank the New York staff who created that document and made it available for public use.
The breadth of data and participation by departments and offices within CalHHS are continually being enhanced and expanded, making open data a dynamic, living initiative. This handbook, providing guidelines for broad publication of publishable state data in electronic, machine-readable form, is the first step in a major shift in the way CalHHS departments and offices share information publicly to promote efficiency, accessibility and transparency; and a significant improvement in the way CalHHS government engages citizens and fosters innovation and discovery in the scientific and business communities. It begins the process of standardizing the state’s data, which will make it easier to discover and use the data. Working in collaboration with others, this Handbook will be supplemented, as needed, with technical and working documents addressing specific formatting, data preparation, data refresh and data submission requirements. CalHHS and its departments and offices will use this handbook in their work as they consider various perspectives involved in governing business processes, data, and technology assets.
HIPAA covered entities in CHHS must de-identify data in compliance with the HIPAA standard. Under the HIPAA standard, either Safe Harbor or Expert Determination must be used. If Expert Determination is used then the documentation of the review is essential. The following may serve as a template for this documentation with the reference to the CHHS DDG to support the analysis documented.
Reason for Data Release:
Identify why the data release does not meet Safe Harbor. For example:
The request does not meet the Safe Harbor standard because it includes counts by county (geographic area smaller than the state) or counts by month (which does not meet the criteria for dates). Therefore, the steps in the CHHS DDG are being used to assess the tables.
After completion of the statistical de-identification process, each department will specify the additional review steps necessary for public release. This may vary depending on the purpose of the release and whether or not the department/program is a HIPAA covered entity.
Recognizing that some data analyses may be published as independent tables while other analyses will be part of larger reports, the final review of all data analyses must follow the department or office procedures for document review in addition to review procedures identified for the implementation of the DDG. The expectation is that the review of data for de-identification will fit into other routine review processes. Reviews outside the DDG portion may vary depending on whether data is being released for a PRA request, to the media, to the legislature, by the program as part of routine reporting, or for other reasons.
Departments and offices may consider the following components for reviews related to data that has been de-identified.
Statistical Review to Assess De-identification (for HIPAA entities this may be an Expert Determination Review)
As noted in , the Publication Scoring Criteria is based on a framework that has been in use by the Illinois Department of Public Health, Illinois Center for Health Statistics. Various other methods have been used to assess risk and the presence of sensitive or small cells. Public health has a long history of public provision of data and many methods have been used. Some of those methods are highlighted here.
Ohio Department of Health published a Data Methodology Standards for Public Health Practice. This method is framed around the concept that a Disclosure Limitation Standard for tabulations of confidential Ohio Department of Health data shall be suppressed when the table denominator value minus the table numerator value is less than 10.
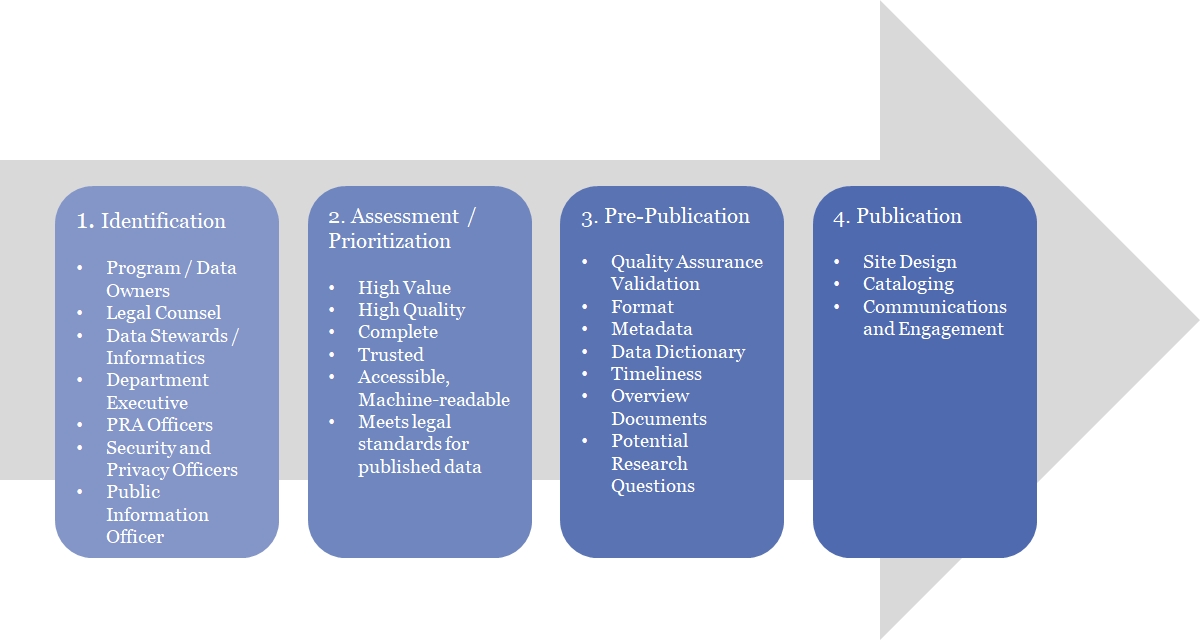
The DDG describes a procedure, the Data Assessment for Public Release Procedure shown in Figure 5, to be used by departments in the CalHHS to assess data for public release. This section, section 4, describes specific actions that may be taken for each step in the procedure with additional supporting information being described in sections 5, 6 and 7. These steps are intended to assist departments in assuring that data is de- identified for purposes of public release that meet the requirements of the California IPA to prevent the disclosure of personal information.
The Data Assessment for Public Release Procedure includes the following steps:
Review the data to determine if it includes personal characteristics, directly or indirectly, that can be tied back to an individual;
If there is concern for personal characteristics, then assess the data for small numerators or denominators;
Supplemental: Example Metadata Repository Tools
Metadata repository platforms save time in the maintenance of your data dictionary and improve access to metadata. Data catalog platforms also make it easier to manage custom metadata, including references to applicable statutes that govern data-sharing. Data catalog platforms also promote the use of your data-sharing artifacts by improving access through web access and search functions.
Standard data catalog features include:
Automated collection of metadata from compatible data sources.
Configurable and customizable metadata labels and tags to address the specific requirements.
Reporting number of psychotropic medications prescribed by a general psychiatrist to include the number of medications prescribed by the age group, sex or race/ethnicity of the patients receiving the medications does tell you about the patients receiving the medications.
Step 1 – Presence of Personal Characteristics
Summary:
Step 2 – Numerator Denominator Condition
Summary:
Step 3 – Assess Potential Risk
Summary:
Step 4 – Statistical Masking
Summary:
Step 5 – Expert Review
Summary:
“Risk is very small that the information could be used, alone or in combination with other reasonably available information, by an anticipated recipient to identify an individual who is a subject of the information”
Legal Review
Departmental Release Procedures
The department or office may designate individuals within the department to provide a statistical review of data products before they are released to ensure the data has been de-identified with methods that are consistent with these guidelines.
For HIPAA covered entities, this will be performed by individuals who are considered experts for the purpose of performing expert determinations in compliance with the HIPAA Privacy Rule, and who meet the Rule’s implementation specifications: “A person with appropriate knowledge of and experience with generally accepted statistical and scientific principles and methods for rendering information not individually identifiable” [45 CFR Section 164.514(b)(1)] This expert determination review, according to the regulation’s requirements, will be performed by:
45 CFR section 164.514 (b)(1) A person with appropriate knowledge of and experience with generally accepted statistical and scientific principles and methods for rendering information not individually identifiable:
(i) Applying such principles and methods, determines that the risk is very small that the information could be used, alone or in combination with other reasonably available information, by an anticipated recipient to identify an individual who is a subject of the information; and
(ii) Documents the methods and results of the analysis that justify such determination
When an expert determination review is requested, the Expert Determination Review must include a document that includes the expert’s determination that “the risk is very small that the information could be used, alone or in combination with other reasonably available information, by an anticipated recipient to identify an individual who is a subject of the information,” attests that the requirements of 45 CFR section 164.514 (b)(1)(i) and (ii) have been met, and includes (or attaches) the documentation required by 45 CFR section 164.514(b)(1)(ii). This document must be signed by the expert.
These guidelines provide a starting point for expert determination review; however, the facts of each case chosen for expert determination review must be analyzed on an individual, case-by-case basis by the expert. If followed, the Guidelines may be referenced as part of the documentation used to support the expert determination. The documentation should also include a general description of the principles, methods, and analyses used, as well as an explanation of the analysis that justifies the expert determination.
The expert determination review may use the Expert Determination Template in Appendix A. The Expert Determination Template includes a confirmation that “the risk is very small that the information could be used, alone or in combination with other reasonably available information, by an anticipated recipient to identify an individual who is a subject of the information.”
If methods that have been used to de-identify the data are not described in the Guidelines, then the Expert will need to provide additional documentation that explains the statistical and scientific principles and methods used and the results of the additional analysis.
Step 5 in the Data Assessment for Public Release Process provides for a legal review within the department. This may vary depending on the purpose of the release and whether or not the department or program is a HIPAA covered entity or not. This review may assess the data to be released for risk to the Department, and for potential implications on litigation, statutory or regulatory conditions on data release, and other legal considerations that may impact release. Legal Services may review the expert determination documentation to ensure compliance with the HIPAA Privacy Rule as applicable.
Step 6 in the Data Assessment for Public Release Process provides for departmental release procedures for de-identified data. After completion of the statistical de- identification process, each department will specify the additional review steps necessary for public release of various data products. Products may include but are not limited to reports, presentation, tables, PRA responses, media responses and legislative responses.
Potential reviews include Public Affairs. Public Affairs is often designated to receive all publications, brochures, or pamphlets intended for public distribution to be printed or reproduced to review the material to determine if it requires Agency Approval or Governor’s Office approval. Public Affairs may also be designated to review content to assess the data table for compliance with the Americans with Disabilities Act of 1990 (ADA).
Departments may also consider processes for quality assurance reviews: The may apply to data products being added to the web sites to ensure that they have had appropriate reviews and de-identification steps. It may also include reviews of updated reports. Many reports maintain the same variables and formats but have updated numbers/information on a periodic basis (monthly, quarterly, annually). For these reports, departments may consider a centralized review to ensure data products are consistent with previously reviewed reports and have not had changes that would change the previous assessment.
Broad support for metadata types, including databases, APIs, and Commercial Off the Shelf (COTS) products.
Compatibility with both cloud and on-premises database platforms.
Store metadata across data sources (e.g., Databases, APIs)
Commercial and open-source platforms are available. Sparx EA (Enterprise Architect) is a commonly used tool that provides data dictionary functionality that may already be in use by your department's Enterprise Architecture team. Your metadata must be widely accessible to be useful. Your selected tool must be easy to use for non-technical staff.
Some example open-source offerings include:
If you elect to use an open-source platform, please have the product evaluated for your department's security and open-source use/license policies.
If you prefer a commercially supported product, there are many available options. Some open- source platforms offer Software as a Service (SaaS) options to access product support and avoid infrastructure maintenance.
A big advantage of general use data catalog products is the ability to store metadata beyond
just your data department’s databases. Many platforms support data cataloging for data sources including:
APIs
Data Extracts
Data Created in Reports
These platforms typically provide useful functions including the ability to Entity Relationship Diagrams (ERD) diagrams and data lineage (traceability) across datasets.
Metadata repository Software as a Service (SaaS) offerings are available from the California Department of Technology (CDT) Off-Premises Cloud Services providers. These products have a low cost and are easily procured. You will need to verify that the cloud-based data catalog products are compatible with all data platforms that are the source of your metadata. Due to their low cost, adopting a cloud-based data catalog platform may be worth considering if it is compatible with your priority data sources. Most of these platforms allow spreadsheet uploads to address other data sources.
If a trial or SaaS option is available, it is a good practice to conduct a proof of concept (POC) before you make a final selection. Additionally, we recommend conducting a pilot with a single dataset before widespread adoption to verify your metadata schema and develop training materials.
3/3/2025
R. Swift
Updated document for web formatting, updated abbreviations/acronyms, and links where appropriate.
1.1
10/1/2016
CHHS
Added [references and links to] CalHHS De-Identification Guidelines
1.0
1/1/2015
CHHS
Initial release
These four terms are highlighted because they are frequently used throughout this document. Additional terms and definitions are listed in the Glossary.
A value or set of values representing a specific concept or concepts. Data includes but is not limited to lists, tables, graphs, charts, and images. Data may be structured or unstructured and can be digitally transmitted or processed.
An organized collection of related data records maintained on a storage device, with the collection containing data organized or formatted in a specific or prescribed way, often in tabular form. In this handbook the dataset refers to the master, primary, or original authoritative collection of the data.
A data table, in this handbook, refers to a subset of the dataset which may include a selection and/or aggregation of data from the original dataset.
Data is Publishable State Data if it meets one of the following criteria: (1) data that are public by law such as via the Public Records Act or (2) the data are not prohibited from being released by any laws, regulations, policies, rules, rights, court order, or any other restriction. Data shall not be released if it is highly restricted due to the Health Insurance Portability and Accountability Act (“HIPAA”), state or federal law (such data are defined as Level 3 later in this handbook).
Colorado Department of Public Health and Environment published Guidelines for Working with Small Numbers which also addresses many of the same topics.
The size of numerators and denominators vary in each of the documents above although the principles are consistent.


Access control to limit access to sensitive information (Specialized Security) to specific staff.
BUCP Fulfillment Duration
Identify the impact of data-sharing and process improvements.
Quantitatively demonstrate the impact of data- sharing investments.
Provide metrics for staff planning.
Identify BUCP process points that impede progress.
BUCP Outcome (Approval, Denial)
Identify needed investments to improve BUCP approval probability.
Provide a source of “lessons learned” to optimize the data-sharing process.
Disputes and Resolutions
Use to create metrics on the frequency of disputes and resolutions.
Statutory Restriction Solutions
Provide a repository to identify approaches (e.g., Data Aggregation, De-Identification) to resolve data-sharing restrictions.
Data-Sharing Outcome and Results
Track the outcome and results of data-sharing to secure management support for investment in related capabilities and staff.


1.0
6/1/2016
CalHHS
Initial Release
1.0
3/3/2025
CalHHS
Initial release of combined product
1.0
12/1/2025
CalHHS/OTSI
Initial Release
2.0
7/1/2017
CalHHS
Added CalHHS sharing materials, other resources
1.1
10/1/2016
CalHHS
Added [references and links to] CalHHS De-Identification Guidelines
1.0
6/1/2016
CalHHS
4.1
8/1/2021
CalHHS
2.0
7/1/2017
CalHHS
Added CalHHS sharing materials, other resources
1.1
10/1/2016
CalHHS
Initial Release
Added [references and links to] CalHHS De-Identification Guidelines
If there is concern for small numerators or denominators, assess potential risk of data release;
If there is potential risk identified, assess the need to apply statistical masking methods to de-identify the data;
Following statistical de-identification, the data release is reviewed by legal if indicated in departmental procedures; and,
After statistical de-identification, the data is reviewed and approved for release based on program and policy criteria pursuant to departmental procedures.
The steps above are represented in a step-wise process shown in Figure 5. Each step is described in further detail in section 4.1 through 4.6.
Data summaries that originate from data which includes personal identifiers must be de- identified before release to the public. Additionally, data summaries about conditions experienced by individuals must be adequately de-identified to prevent re-identification of individuals represented by the summarized data. Various statistical methods are available to statistically de-identify data.
Summarized data may be reviewed in the context of the numerator and the denominator for the given presentation. The numerator represents the number of events being reported while the denominator represents the population from which the numerator is taken. For example, if it is reported that there are 50 cases of diabetes in California then the numerator would be the number of cases (50) and the denominator would be the number of people in California that could have diabetes (more than 38 million people since diabetes can occur at any age or sex). While the numerator is relatively straight-forward to identify, the denominator can be difficult. Data summaries are frequently presented in tables in which numerators and denominators may be identified.
The numerator is typically the value in each table cell. However, the denominator can be difficult to identify given the various ways in which tables are prepared. Two examples of tables, Figure 3 and Figure 4, show the numerators and denominators in sample tables.
Figure 3 shows an example table with the numerator and the denominator highlighted. The Cells in the table are the boxes with values in them, as opposed to the row and column headings. The row headings are 2012 and 2011. The column headings are Year, # of Medi-Cal Members in Fee For Service (in thousands) and Number of Medi- Cal Members in Managed Care (in thousands). In Figure 3, “2,775” is the value in a table cell and represents a numerator. The sum of the row for year 2012 (2,775 + 4,853
= 7,628) represents a denominator. In this context, the denominator may represent row totals, column totals or the total occurrences in the data set released. Data in Figure 3 comes from the “Trend in Medi-Cal Program Enrollment by Managed Care Status - for Fiscal Year 2004-2012, 2004-07 - 2012-07.”
Figure 4 shows another type of table that contains rates. In this case, the numerator is the number of Salmonella cases for a sample of California Local Health Jurisdictions in 2014. The table also includes the rate of Salmonella for these jurisdictions. In order to calculate the rate, the population size of each jurisdiction is required, but is not shown directly in this table. The population denominator is an important element for data de- identification.
Discovery sessions are an effective approach to effectively gather information from staff across your department. There is no set format for a discovery session. Discovery session questions will be context-specific to your department’s needs and the program(s) related to a data set.
Some key aspects of an effective discovery session include:
Research Ahead of Time: Review any available data architecture and program documentation to identify initial questions and build context before the discovery session. Reviewing materials ahead of the meeting also ensures efficient use of participant time.
Prepare Your Questions: Creating a set of discovery questions helps ensure you obtain the information you need on the data set. Be prepared for additional topics and questions to arise organically during the discovery session.
Capture the Information: Ideally, have one person ask the discovery questions while another captures meeting notes. Often this is impossible. If acceptable to the participants, record the meeting for later review.
Confirm Your Understanding: Communicate your understanding to participants for confirmation and clarity.
When scheduling discovery sessions, include context for the effort and the objectives for the discovery session. To establish a common understanding, the session should start with a definition of data-sharing; examples of data-sharing help provide additional context. The provides some short videos that review impactful data-sharing efforts.
The article from UX Everything provides useful tips for preparing and conducting discovery sessions.
Statistical masking provides an extensive set of tools that can be used to mitigate potential risk in a given data presentation. As discussed in Section 4.4, the data releaser will assess the need for statistical masking when the assessment in Step 3 identified potential risk. Each department will document statistical masking processes that are routinely used in data preparation for public release.
As discussed in section 4.4, initial methods to address sensitive or small cells, as well as complimentary cells include the following:
Reduce Table Dimensions
Reduce Granularity of Variable(s), aka Recoding or Aggregation
The DDG workgroup reviewed the published literature including information from other states and from the federal government. There was a great deal of variation in the numerical values chosen for the Numerator Condition. While the Centers for Disease Control and Prevention (CDC) WONDER database suppresses cells with numerators less than 10, the National Environmental Public Health Tracking Network suppresses cells that are greater than 0 but less than 6. Examples range from 3 to 40 with many being 10 to 15. The Centers for Medicare and Medicaid Services (CMS) uses a small cell policy of suppressing values derived from fewer than 11 individuals. As stated in a 2014 publication associated with a data release of Medicare Provider Data, “to protect the privacy of Medicare beneficiaries, any aggregated records which are derived from 10 or fewer beneficiaries are excluded from the Physician and Other Supplier PUF [public use file]
A critical step in reviewing data for public release is the consideration of what other data may be publicly available that could be used in combination with the newly released data to identify the individuals represented in the data. This section will highlight some specific data sets that are publicly available that may be used in combination with CHHS data that would contribute to potential increased risk.
Common kinds of data with personal information include: real estate records, individual licensing databases (MD, RN, contractors, lawyers, etc.), marriage records, news (and other) media reports, commercially available databases (data brokers, marketing), court documents, etc.
Another common data set for programs to be aware of are the publicly available electronic birth and death indices from Vital Records, as specified in Health and Safety Code section 102230(b).
CalHHS programs develop a wide range of information based on different types of data. This is reflected in the various categories shown on the entry page for the CalHHS Open Data Portal, which include:
Diseases and Conditions
Facilities and Services
Healthcare
The CHHS Data Subcommittee requested the convening of the CHHS Data De- Identification Workgroup to develop the DDG.
The DDG Workgroup began with an orientation to the topic of data de-identification and presentations by the DHCS, OSHPD and California Department of Public Health (CDPH) regarding current practices and activities related to data de-identification. The DDG Workgroup used the Public Aggregate Reporting for DHCS Business Reports (PAR-DBR) as a starting point for initial drafts. The PAR-DBR had been developed between April and August, 2014 through a workgroup processes within DHCS with input and presentations from OSHPD, CDPH, and University of California, Los Angeles California Health Interview Survey. The PAR-DBR served as a basis for this document, including the literature review conducted as part of the development of the PAR-DBR.
The development process was designed to include an updated literature review, case examples and broad discussion among CHHS programs. Publishing data publicly is always a balance between the protection of confidentiality and the usability of the data.
The project timeline for the CHHS DDG Workgroup is below:
CalHHS collects, manages, and disseminates a wide range of data. As departments classify data tables and catalog their publishable state data, they should be mindful of legal and policy restrictions on publication of certain kinds of data. Following are general guidelines regarding disclosure to consider as departments begin to identify and review data tables.
The CalHHS Data Subcommittee commissioned the development of Agency-wide guidelines to assist departments in assessing data for public release. The are focused on de-identification of aggregate or summary data. Aggregate data means collective data that relates to a group or category of services or individuals. The aggregate data may be shown in table form as counts, percentages, rates, averages, or other statistical groupings. Refer to the for the specific procedures to be used by departments and offices.
This section will help Departments move from conversation to action. It will provide resources that will allow the Departments to succeed. This might include: roles and responsibilities; governance structures; and data standards. It also includes resources on project management and change management to help both staff implement and leadership enforce the importance of this work.
This content moves away from the theoretical and drives toward the tactical.
By detailing all critical steps before starting the project, the Department can anticipate factors they otherwise would not consider until encountered and identify potential problems and challenges on the front end.
The planning becomes proactive instead of reactive, which allows best practices to be used and ensures that energy and time are spent on implementing a high-quality, well‐thought‐out project rather than "putting out fires."
The planning and implementation processes will allow any person working on the project, regardless of his or her level of involvement, to fully understand the goal of the project and how it is to be accomplished. It ensures that everyone working on the project is on the same page and that any discrepancies are resolved before they become costly to the project or population served.
This play includes various resources designed to help with project management and data management.
Small cell sizes are typically encountered when one of the following conditions is met.
Multiple variables. This most often occurs in a pivot table presentation or a query interface where a user may have occurrences of disease X, stratified by county, stratified by sex, stratified by race and ethnicity.
Granular variables. The more granular the variable the smaller the potential numerator and denominator. This most commonly occurs with shortening the time period of reporting (weekly) or making the geography more specific (zip code or census tract). However, it can also occur when there are many categories for a variable. An example of this is aid codes in Medi-Cal where there are almost 200 aid codes.
Rare events. Examples include diseases such as hemophilia. Examples of incidents may result from mass trauma events such as a plane crash or multi- car accident.
In each of these cases, statistical masking may be addressed in a number of ways. For this reason, it is important to keep in mind the purpose for the reporting so that the method chosen for masking can still maximize the usefulness of the data provided. Choices for each condition are highlighted below.
Multiple variables. Options include separating the table into multiple tables that limit the number of variables included in each table; decreasing the granularity of the variables included in the table; or suppressing the small cell with an indicator that it is less than 11.
Granular variables. A common approach to this situation would be to decrease the granularity of the variables although suppressing the small cell with an indicator that it is less than 11 is also an option.
Rare events. In these cases it becomes very challenging to suppress the value in a way that it will not be able to be used with other public information to identify individuals. Additionally, with rare events, there is more significance in the variance of small numbers.
In addition to small cells, complementary cells must also be suppressed. Complementary cells are those which must be suppressed to prevent someone from being able to calculate the suppressed cell based on row or column totals in combination with other data in that row or column.
Suppressing small cell values and complimentary cells can be done in two ways.
Use a symbol to indicate the cell has been suppressed. Identify any other cells (complimentary cells) that can be used to calculate the small cell and use a symbol to indicate the cell has been suppressed.
Use a symbol to indicate the cell has been suppressed or leave the cell blank and remove the value from all pertinent row and column totals so that the cell cannot be calculated. This negates the need for evaluation of complementary cells. This method must be used with great caution because the totals may actually be published in other non-related tables. For this reason the method is not recommended.
When suppressing values, the following footnote to indicate the suppression is recommended:
“Values are not shown to protect confidentiality of the individuals summarized in the data.”
In addition to the above, there are a number of other methods that may be used for Statistical Masking. Methods discussed in the “Statistical Policy Working Paper 22 (Second version, 2005), Report on Statistical Disclosure Limitation Methodology” include the following for tables of counts or frequencies and for magnitude data.
Tables of Counts or Frequencies
Sampling as a Statistical Disclosure Limitation Method
Defining Sensitive Cells
Special Rules
The Threshold Rule
Protecting Sensitive Cells After Tabulation
Suppression
Random Rounding
Controlled Rounding
Controlled Tabular Adjustment
Protecting Sensitive Cells Before Tabulation
Tables of Magnitude Data
Defining Sensitive Cells – Linear Sensitivity Rules
Protecting Sensitive Cells After Tabulation
Protecting Sensitive Cells Before Tabulation
Just as there is no consistent value for the Numerator Condition, neither is there a consistent value for the Denominator Condition. Some examples include:
National Center for Health Statistics (public micro-data) – 250,000
National Environmental Health Tracking Network – 100,000
Maine Integrated Youth Health Survey – 5,000
In establishing a minimum denominator to protect confidentiality, the DDG workgroup began by looking at the risk associated with providing geography associated with record level data. As noted in the “Guidance Regarding Methods for De-identification of Protected HIPAA Privacy Rule”, published November, 2012 by the U.S. Department of Health & Human Services, Office for Civil Rights there is varying risk based on the level of zip code and how the zip code is combined with other variables. It has been estimated that the combination of a patient’s Date of Birth, Sex, and 5-Digit ZIP Code is unique for over 50% of residents in the United States. This means that over half of U.S. residents could be uniquely described just with these three data elements. In contrast, it has been estimated that the combination of Year of Birth, Sex, and 3-Digit ZIP Code is unique for approximately 0.04% of residents in the United States. For this reason, the HIPAA Safe Harbor rule specifies that the 3-Digit ZIP Code can be provided at the record level if the 3- Digit ZIP Code has a minimum of 20,000 people. By aggregating data for a given 3- Digit ZIP Code, the potential for identifying a unique individual is less than 0.04%.
By combining with the Numerator Condition, the risk becomes less than 0.04% because there will be a minimum of 11 individuals with a particular age and sex for the 3-Digit ZIP Code. Additionally, most tables will provide additional levels of aggregation further reducing risk. This reduction of risk is discussed further with respect to the Publication Scoring Criteria.
A minimum denominator of 20,000 was chosen as part of the numerator- denominator condition to leverage the risk assessment cited above.
The Numerator-Denominator Condition serves as an initial screening to assess potential risk for a data set. If this condition is met, additional analysis is not necessary. If the condition is not met, then the analysis proceeds to Step 3.
The Publication Scoring Criteria is provided as an example of a method that meets the requirements of Step 3 in the Data Assessment for Public Release Procedure. It is a tool to assess and quantify potential risk for re-identification of de-identified data based on two identification risks: size of potential population and variable specificity. The Publication Scoring Criteria is used to assess the need to suppress small cells as a result of a small numerator, small denominator, or both small numerator and small denominator where a small numerator is less than 11 and a small denominator is less than 20,001. That is why the Publication Scoring Criteria takes into account both numerator (e.g., Events) and denominator (e.g., Geography) variables.
The Publication Scoring Criteria is based on a framework that has been in use by the Illinois Department of Public Health, Illinois Center for Health Statistics. Various other methods have been used to assess risk and the presence of sensitive or small cells. Public health has a long history of public provision of data and many methods have been used. Further discussion of other methods used to assess tables for sensitive or small cells is found in Section 6.3: Assessing Potential Risk.
This section provides a more detailed review of the criteria that make up the Publication Scoring Criteria.
First, middle, and last name
Sex
Date of birth
Place of birth
The following are provided in the death record indices:
First, middle, and last name
Sex
Date of birth
Place of birth
Date of death
Place of death
Father’s last name
Other potential sources of publicly available data to consider are informational certified copies of birth and death certificates. In California, anyone can obtain an informational certified copy of birth and death certificates, which are clearly marked as un-authorized copies that cannot be used to verify identity. In reality, it is difficult to use these as a dataset for the following reasons:
Certified copies of birth and death certificates must be obtained on an individual basis, and you must be able to identify the record. In other words, an individual cannot simply ask for a stack of certificates for purposes of creating a dataset.
Certified copies are issued on specialized banknote paper, not in electronic format, which creates a problem of scale when trying to create a dataset.
There is a $25 fee for each certified copy of a birth certificate and $21 for a certified copy of a death certificate, which also creates a problem of scale when trying to create a dataset.
Certified copies are meant for individual use. A request for a large amount of certificates may generate an investigation among vital records staff as to why so many certificates were requested at once.
As additional data sets are added to the Open Data Portal, programs need to take that information into account when considering potential risk for any given data set. The CHHS Open Data Workgroup will be providing easier access to both lists of data currently on the portal as well as data sets planned for addition to the porta. While significant with over 100 data sets, this is not exhaustive because of the PRA, which allows for an extremely broad amount of information to be released in a sporadic way. So some specificity can occur but not completely. CHHS departments have a duty of due diligence in the de-identification process regarding consideration of published identifiable data, published de-identified data and the soon to be published de-identified data.
Listed below are individual records or documents that the Department of Rehabilitation have available to the public:
Fair Hearing Decisions include appellant’s initials and possibly other information, depending on issue appellant presents for hearing, such as sex, disability, employment, education, vocational rehabilitation services, etc.; and
Monthly Operating Reports and information therefrom includes names of licensees and financial information regarding the operation of the licensees’ operation of vending facilities in the Business Enterprises Program for the Blind. To be eligible for this program, the individuals must be legally blind.
The Demographic Research Unit (DRU) of the California Department of Finance is designated as the single official source of demographic data for state planning and budgeting.29 The DRU produces the following products which serve as the basis for understanding the population characteristics and distributions that frequently make up the denominators in the review of data sets.
Estimates - Official population estimates of the state, counties and cities produced by the Demographic Research Unit for state planning and budgeting.
Projections - Forecasts of population, births and public school enrollment at the state and county level produced by the Demographic Research Unit.
State Census Data Center - Demographic, social, economic, migration, and housing data from the decennial censuses, the American Community Survey, the Current Population Survey, and other special and periodic surveys.
With the growth of social media, people frequently share information through tools such as Facebook, Linked In, and Tweets. While it would be impossible to take into account all information that people make public about themselves, there is an expectation that a certain amount of information is likely to be in the public domain based on information individuals frequently provide about themselves. Examples of such information include wedding dates, birth dates, education (high school, college) and professional certifications.
Geographic information is particularly suited to being combined with other geographic information given the relatively standardized was data is coded (latitude, longitude, county, etc.) With the use of mapping tools, various information can be combined in a way that is called a “mash up.”
“A mashup, in web development, is a web page, or web application, that uses content from more than one source to create a single new service displayed in a single graphical interface. For example, you could combine the addresses and photographs of your library branches with a Google map to create a map mashup.[1] The term implies easy, fast integration, frequently using open application programming interfaces (open API) and data sources to produce enriched results that were not necessarily the original reason for producing the raw source data."
http://en.wikipedia.org/wiki/Mashup_(web_application_hybrid)
Workforce
Environmental
Demographics
Resources
Various types of reporting may or may not have a connection to personal characteristics that would create potential risk of identifying individuals.
The following list of variables is important to consider when preparing data for release.
Age
Sex
Race
Ethnicity
Language Spoken
Location of Residence
Education Status
Financial Status
Number of events
Location of event
Time period of event
Provider of event
As stated previously, variables that are personal characteristics may be used to determine a person’s identity or attributes. When these characteristics are used to confirm the identity of an individual in a publicly released data set, then a disclosure of an individual’s information has occurred. Individual uniqueness in the released data and in the population is a quality that helps distinguish one person from another and is directly related to re-identification of individuals in aggregate data. Disclosure risk is a concern when released data reveal characteristics that are unique in both the released data and in the underlying population. The risk of re-identifying an individual or group of individuals increases when unique or rare characteristics are “highly visible”, or otherwise available without any special or privileged knowledge. Unique or rare personal characteristics (e.g., height above 7 feet) or information that isolate individuals to small demographic subgroups (e.g., American Indian Tribal membership) increase the likelihood that someone can correctly attribute information in the released data to an individual or group of individuals.
Variables that are event characteristics are often associated with publicly available information.
Therefore, increased risk occurs when personal characteristics are combined with enough granularity with event characteristics. One could argue that if no more than two personal characteristics are combined with event characteristics then the risk will be low independent of the granularity of the variables. This hypothesis will need to be tested using various population frequencies to quantify the uniqueness of the combination of variables both the in the potential data to be released as well as in the underlying population.
Survey data, often collected for research purposes, are collected differently than administrative data and these differences should be considered in decisions about security, confidentiality and data release.
Administrative data sources (non-survey data) such as: vital statistics (e.g. births and deaths), healthcare administrative data (e.g. Medi-Cal utilization; hospital discharges), reportable disease surveillance data (e.g. measles cases) contain data for all persons in the population with the specific characteristic or other data elements of interest. Most of the discussions in this document pertain to these types of data.
On the other hand, surveys (e.g. the California Health Interview Study) are designed to take a sample of the population, and collect data on characteristics of persons in the sample, with the intent of generalizing to gain knowledge suggestive of the whole population.
The sampling methodology developed for any given survey is generally developed to maximize the sample size with the available resources while making the sample as un- biased (representative) as possible. These sampling procedures that are a fundamental part of surveys generally change the key considerations for protection of security and confidentiality. In particular, the main “population denominator” for strict confidentially considerations remains the whole target population, not the sampled population. But, if persons have special or external knowledge of the sampled populations (e.g. that a family member participated in the survey), further considerations may be required. Also, it is in the context of surveys that issues of statistical reliability often arise—which are distinct from confidentially issues, but often arise in related discussions.
Of particular note, small numbers (e.g. less than 11) of individuals reported in surveys do not generally lead to the same security/confidentiality concern as in population-wide data, and as such should be treated differently than is described within the Publication Scoring Criteria and elsewhere. In this case a level of de-identification occurs based on the sampling methodology itself.
Budget reporting may include both actuals and projected amounts. Projected amounts, although developed with models that are based on the historical actuals, reflect activities that have not yet occurred and, therefore, do not require an assessment for de-identification. Actual amounts do need to be assessed for de-identification. When the budgets reflect caseloads, but do not include personal characteristics of the individuals in the caseloads, then the budgets are reflecting data in the Providers and Health and Service Utilization Data circles of the Figure 2 Venn Diagram and do not need further assessment. However, if the actual amounts report caseloads based on personal characteristics, such as age, sex, race or ethnicity, then the budget reporting needs to be assessed for de-identification.
Many CalHHS programs oversee, license, accredit or certify various businesses, providers, facilities and service locations. As such, the programs report on various metrics, including characteristics of the entity and the services provided by the entity.
Characteristics of the entity are typically public information, such as location, type of service provided, type of license and the license status.
Services provided by the entity will typically need to be assessed to see if the reporting includes personal characteristics about the individuals receiving the services. Several examples are shown below.
Reporting number of cases of mental illness treated by each facility – if the facility is a general acute care facility then the reporting of the number of cases does not tell you about the individuals receiving the services.
Reporting number of cases of mental illness treated by each facility – if the facility is a children’s hospital then the reporting of the number of cases does tell you about the individuals receiving the services.
Reporting number of psychotropic medications prescribed by a general psychiatrist does not tell you about the patients receiving the medications.
Reporting number of psychotropic medications prescribed by a general psychiatrist to include the number of medications prescribed by the age group, sex or race/ethnicity of the patients receiving the medications does tell you about the patients receiving the medications.
In (a) and (c) above, assessment for de-identification is not necessary as there are no characteristics about the individuals receiving the services. However, in (b) and (d) above, the inclusion of personal characteristics which may be quasi-identifiers, especially when combined with the geographical information about the provider, does require an assessment for de-identification.
CalHHS programs are required to provide public reporting based on federal and California statute and regulations, court orders, and stipulated judgments, as well as by various funders. Although reporting may be mandated, unless the law expressly requires reporting of personal characteristics, publicly reported data must still be de-identified to protect against the release of identifying or personal information which may violate federal or state law.
1.0
9/23/2016
L. Scott
Revisions based on direction from the CHHS Undersecretary. Approved as Version 1.0 for implementation.
2/1/2025: Updated document web formatting, and links where appropriate.
0.10
7/11/2016
L. Scott
Formatting and citations edits to be consistent with previous version 0.8
0.9
7/5/2016
P. Cervinka
Revisions based on clarification from the CHHS Governance Advisory Council
0.8
6/17/2016
L. Scott
Revisions based on direction from the CHHS Governance Advisory Council and input from the CHHS Risk Management Committee
0.7
5/3/2016
L. Scott
Revisions based on feedback from and discussion with the Data Subcommittee
0.6
4/4/2016
L. Scott
Revisions based on feedback from and discussion with the Data Subcommittee
0.5
3/18/2016
L. Scott
Revisions based on comments from CDPH, CDSS, OSHPD, DHCS.
0.4
1/22/2016
L. Scott
Revisions based on recommendations from:
0.3
8/5/2015
L. Scott
Additions and changes based on feedback from all departments with specific written comments from CDPH, OSHPD, DCSS, CDSS, MHSOAC.
0.2
6/29/2015
L. Scott
Additions made based on feedback:
0.1
5/26/2015
L. Scott
Initial draft for review which was based on the DHCS PAR-DBR Guidelines dated 8/25/14 and conversations at the CHHS Data De- identification Workgroup meetings.
The public release of some department data might result in the violation of laws, rules, or regulations. Some data may not be appropriate to release because it can compromise internal departmental processes, such as procurement. Other data may contain personally identifiable information. Finally, even if detailed data appear innocuous, it may be possible to combine it with other public information to reveal sensitive details (commonly known as the mosaic effect). Before disclosing potential personally identifiable information or other potentially sensitive information, departments and offices must make a 'best effort' to consider other publicly available data – in any medium and from any source – to determine whether some combination of existing data and the data intended to be publicly released present any risks or would make the publication inappropriate.
Before disclosing potential personally identifiable information or other potentially sensitive information, departments and offices must consider other publicly available data – in any medium and from any source – to determine whether some combination of existing data and the data intended to be publicly released present any risks or would make the publication inappropriate. Common kinds of data with personal information include: real estate records, individual licensing databases (MD, RN, contractors, lawyers, etc.), marriage records, news (and other) media reports, commercially available databases (data brokers, marketing), court documents, etc. See the ‘Publicly Available Data’ section in the CalHHS Data De-Identification Guidelines for more information.
Even if there are no legal impediments to publishing the data, releasing it may have unintended or undesirable effects. For example, posting anonymized arrest records on a weekly basis might inadvertently reveal where police are concentrating enforcement efforts.
Various statutes and regulations, such as HIPAA and California's health information privacy laws, have very exacting requirements for determining whether data have been sufficiently de-identified so as not to compromise individual privacy. For example, the presence of medical conditions by geographic location might constitute high value, useful, and sought-after data; however, exposing it might identify individuals and their medical conditions.
Another example is the Family Educational Rights and Privacy Act of 1974 (FERPA). Under FERPA, the Federal Government has established guidelines for data privacy to prevent individuals from being identified indirectly from aggregation of data. Departments that deal with student educational data should be aware of guidelines that restrict publication of some data.
Even in the absence of specific legal prohibitions, government entities should beware of outlier conditions or rare events that could lead to identification of individuals. For example, identifying a single arrestee who is a minor of a certain age in a certain county without providing any other information, might nonetheless serve to identify that particular individual.
All data needs to be assessed for potential risk of identification of individuals represented in the data for whom there are laws that protect the privacy of those individuals. Laws include both federal and state laws. In order to assist departments and offices in this process, the CalHHS Data Subcommittee commissioned the development of the CalHHS Data De-identification Guidelines. These Guidelines discuss various methods for assessing potential risk associated with data sets proposed for release and various statistical methods that can be used to mask data and protect individuals from being inappropriately identified in the data tables. For example, if a cell in a particular data table goes below a certain number of individuals, the value in that particular cell may be hidden. It is important to balance desires to publish accurate, complete, and valuable tabulations against the need to guard against unwarranted invasions of personal privacy. Refer to the CalHHS Data De-Identification Guidelines for the specific procedures to be used by departments and offices to assess data for public release.
Under the Public Records Act the presumption is that government records shall be open to the public, unless excludable under a narrow set of specific exemptions including such concerns as invasion of personal privacy, impairment of contractual or collective bargaining negotiations, exposure of protected trade secrets, interference with law enforcement or judicial proceedings, endangering life or safety, and others. Government entities should confer with their PRA officers for advice as to whether a data table might cause the harms described in the PRA law, and therefore would not constitute "publishable state data" for the CalHHS Open Data Portal.
In some circumstances, a CalHHS department or office may not possess all the necessary rights to be able to publish a specific data table. For example, if the data were collected or compiled by a third party, there may be a contractual or intellectual property limitation which prevents it from being made public. Another example would be when a data table includes a partial data table collected or compiled by a third party. In these cases, the appropriate permission must be secured from the sourcing entity, and additional disclaimers may be required. Departments and offices should ensure that their legal counsel is aware of a potential ownership issue and/or that the data were compiled or collected by a third party when vetting a data table through the approval process.
This could be a risk in terms of deployment costs and the time it takes to implement an open data portal. The experience of other states and several counties is that no additional human resources have been required to implement and maintain an open data portal. CalHHS has chosen a vendor-based product that is anticipated to make deployment as easy as possible.
Despite the participating Department's best efforts, it is possible that some data will be inaccurate and analyses may turn up issues that the public was unaware of and the press covers. When any concerns about inaccurate data are brought to the attention of the participating Department, the department will look into the matter and corrections will be made as appropriate.


Planning Meeting Part 1 – Participants included DHCS, CDPH, OSHPD, OHII
3/20/2015
Planning Meeting Part 2 – Participants included DHCS, CDPH, OSHPD, OHII
4/7/2015
Present Objectives for the project and use the DHCS PAR-DBR as an example
4/23/2015
Presentations from OSHPD and CDPH regarding current processes and approach to small cell sizes
5/5/2015
Discuss concept of uniqueness as a way to measure risk for re- identification and gather input from Departments/Offices regarding DDG variables and topics
5/27/2015
Review initial draft DDG – Focus on new sections of the document
6/8/2015
Review initial draft DDG – Focus on Data Assessment for Public Release Procedure
May & June 2015
Meet with each department/office individually
6/30/2015
Review draft DDG version 0.2
July 2015
Departments/offices vet the DDG within their departments/offices 8/21/15
8/6/2015
Review draft DDG version 0.3
8/21/2015
Received input from the CHHS Risk Management Committee
9/14/2015
Progress update for DDG Workgroup and discussion of additional topics
12/18/2015
Presentation from NORC to review their findings of the draft DDG 1/8/16
January 2016
Provide DDG version 0.4 to DDG Workgroup
1/8/2016
Receive final recommendations from NORC
2/18/2016
Review and discussion of draft DDG version 0.4 with the DDG Workgroup
3/18/2016
Provide DDG version 0.5 with outstanding comments from the DDG Workgroup to the Data Subcommittee
4/18/2016
Provide revised draft DDG to the Data Subcommittee.
5/24/2016
Provide draft DDG version 0.7 from the CHHS Data Subcommittee to the CHHS Advisory Council. The Advisory Council shared the DDG version 0.7 with the other subcommittees and discussed the version 0.7 at the 6/8/16 meeting and the version 0.8 at the 7/6/16 meeting.
7/7/2016
Provide draft DDG version 0.10 to the Undersecretary.
9/23/2016
DDG approved by CHHS Undersecretary as Version 1.0.
3/15/2015
Departments will work to identify Data Sharing and Data De-Identification best practices and lessons learned.
The Project Management Resources will include resources on: agile planning and development; resource management; training; communication; and governance.
The Data Management Resources will include resources on: data access and publishing; data standards; data documentation; and data tools and analytics.
Action Item: Define roles and responsibilities; utilize a goverance structure; allow for risk and embrace failures.
CHHS collects, manages and disseminates a wide range of data. As Departments classify data tables and catalog their publishable state data, they should be mindful of legal and policy restrictions on publication of certain kinds of data. The CHHS Data Subcommittee commissioned the development of Agency-wide guidelines to assist Departments in assessing data for public release.
The CalHHS Data De-Identification Guidelines support CalHHS governance goals to reduce inconsistency of practices across Departments, align standards used across Departments, facilitate the release of useful data to the public, promote transparency of state government, and support other CHHS initiatives, such as the CalHHS Open Data Portal. See the full guidelines in the CalHHS Data De-Identification Guidelines section.
The CHHS Data De-Identification Guidelines are the default policy for CHHS departments. If a CHHS Department wants to customize the guidelines, it must have appropriate references to departmental processes and must file a copy of their guidelines with the Office of the Agency Information Office. While most state agencies are covered by the California Information Practices Act (IPA), some are also covered by or impacted by HIPAA, the United States Health Insurance Portability and Accountability Act. Unlike the IPA, which applies to all personal information, HIPAA only applies to certain health or healthcare-related information. HIPAA requirements apply in combination with IPA requirements. For Departments covered by HIPAA, de-identification must meet the HIPAA standard. The CHHS Data De-Identification Guidelines serve as a tool to make and document an expert determination consistent with the HIPAA standard.
Data sharing at CalHHS is governed by the CHHS Data Exchange Agreement. The CalHHS Data Exchange Agreement is bifurcated into two parts—one master agreement with general legal boilerplate language and subordinate "Business Use Case Proposals" containing the specific business case to document each data exchange under the master agreement. The Business Use Case Proposal includes information such as data elements, intended use, etc. The master agreement, when coupled with the Business Use Case Proposal, forms the complete, standardized, legally-compliant data sharing agreement.
The goals of data sharing at CalHHS are to:
Establish a legal framework for data initiatives
Maximize appropriate sharing to increase positive outcomes and customer service
Ensure privacy and security protections
Reduce risk and use of duplicative resources
Standardize data use agreements among CHHS Departments and offices
Reduce contracting and data use agreement redundancies
Track activity for better understanding of common data sharing needs between CHHS departments
See the CHHS Data Exchange Agreement, Business Use Case Proposal, and related data sharing materials in the Resource Library.
Data Sharing Tips:
The CalHHS data sharing process encourages collaboration between departments. Start by requesting a meeting with the data provider to talk through your business use case. You will likely find the data provider has important insights about the data you are requesting.
The CalHHS data sharing process requires data providers to work with the Departmental Data Coordinator in the development of a Business Use Case Proposal. Data coordinators will help programs refine Business Use Case Proposals so that they can be successful. If the two parties cannot come to agreement, the data coordinators will assist in taking the request to the Risk Management Subcommittee to help moderate the dispute.
The CalHHS Data Exchange Agreement and associated resources govern intra-agency data sharing between CalHHS departments. Considering using these resources as templates for data sharing agreements with California government agencies, local governments, and universities as well.

The Data-Sharing Plays (Plays) improves data data-sharing by:
Improving understanding of your data by external departments and internal data consumers.
Mitigating late detection of security, privacy, and statutes during Business Use Case Proposal (BUCP) approvals.
Providing a detailed description of your data to facilitate data requestors properly scoping datasets.
Automating inventory of data fields to complete the BUCP Technical Fields.
Implementing technical and security capabilities to receive shared data from other programs.
Establishing BUCP metric tracking to optimize processes and data-sharing planning.
The Plays can be executed proactively before data-sharing requests or in parallel with a BUCP approval. Completing the Plays requires resource investment by your department but will provide benefits for data sharing with other organizations and direct benefits to your department. One of the participants in the Guidebook discovery sessions summarized the investment of time and future benefits as follows:
“We are willing to invest time upfront to save time in the future.”
– Discovery Session Participant from a CalHHS Department.
The Plays contain data architecture practices (the What) that support data-sharing and guidance to implement them (the How). A series of vignettes that depict a fictional department’s journey to improve its data-sharing capabilities are used to provide further context and implementation guidance. Not all Plays may be pertinent to your organization, depending on your existing data-sharing capabilities. We recommend reviewing the Guide in its entirety and leveraging concepts that benefit your department.
The examples and vignettes are based on extracting data from a database to address a common source of shared data. The Data-Sharing Plays are adaptable to data exchanges that use Application Program Interfaces (APIs) or other data integration architectures.
The Plays include a series of vignettes featuring a fictional CalHHS department (California Department of Wellness) to provide context for each Play. The vignettes further elaborate each Play by telling a story that demonstrates how to its guidance into action. Reading the vignettes is optional but recommended as they offer valuable context and practical examples of the data- sharing plays in action.
The personas and their roles depicted in the vignettes are examples to illustrate the concepts described in the Plays. The roles and responsibilities of the vignette’s personas may be different from your department’s structure.
The California Department of Wellness (CDW) was established in 1997 to improve the health and well-being of Californians. The CDW focuses on various aspects of wellness, like physical health, mental health, and social engagement. The CDW’s programs are interrelated with those managed by other departments under CalHHS. Although CDW is a small department, it manages over a dozen programs and supporting systems developed independently in response to various legislation over the past 20 years. Some primary CDW programs include:
Healthy Habits is a CDW program that raises awareness about healthy lifestyle habits through various marketing campaigns, collaborations with Community-Based Organizations (CBO), and healthcare providers.
Walk2Work (W2W) encourages people to engage in additional physical activity to improve their overall wellness and to facilitate social interaction between commuters. The Healthy Habits program collaborates with the W2W program to promote physical activity initiatives.
Your Environment program aims to educate Californians about the significance and advantages of engaging with their communities and enjoying the beautiful spaces within the state. The program conducts outreach activities through marketing campaigns and works with community-based organizations. Your Environment also collaborates frequently with the Department of Volunteer Services and the Department of Outdoor Recreation to achieve its goals.
Other CalHHS departments utilize program data from the CDW to understand the impact of wellness on their program outcomes.
Meet the core team that is working on the CDW data-sharing improvement effort:
Sally is the CDW Data Coordinator (DC). Prior to joining the CDW, she worked at a local government social services department that utilized data-driven practices. Sally leads the data-sharing improvement effort and coordinates with participating staff.
Carlos recently joined the CDW 6 months ago as the Data Architect and Lead Database Administrator. He previously worked at another department outside of CalHHS as a database administrator and is learning about the CDW environment. Carlos is helping Sally with the technical aspects of data-sharing.
Andrea is the manager of CDW Information Technology Services (ITS). Her team includes the application and data support teams that will provide information to enhance the CDW data architecture. The ITS team has minimal resource capacity for anything beyond regular system support.
Other CDW staff that will help improve data sharing are introduced as they appear in Play- specific vignettes.
Sally recently facilitated a team retrospective after providing data under a BUCP to share a portion of the Healthy Habits program data. Common themes from the team’s feedback include:
We are sharing the same data; it would be helpful to have some reusable materials to reduce the time necessary to establish a BUCP and provide data.
A statute governing data-sharing was identified late in the BUCP approval and created delays.
Determining what data can be shared is labor intensive, as is identifying data elements, metadata, and their security classifications.
After providing data, CDW staff are spending time answering data-related questions from departments receiving CDW data.
Based on these findings, Sally is launching an effort to improve CDW’s ability to share data using the Data-Sharing Plays.
This Guidebook comprises eight Data-Sharing Plays that aim to improve your ability to share and receive data. The roadmap below depicts the relationships of the Plays and their suggested order of execution:
The tables below summarize the Plays and their primary objectives:
Data de-identification practices will be implemented by each department and office (further referred to as department) in the agency. This DDG is the default policy for CalHHS departments. If a CalHHS department wants to create a department DDG, it must have appropriate references to departmental processes and the department must file a copy of their DDG with the Office of the Agency Information Officer (OAIO). For example, the Legal Review process and the Departmental Release Procedures for De- Identified Data require additional information to describe these steps within each department. Additionally, a department with programs not covered by HIPAA will not require specific HIPAA references. A department must request DDG consultation from the CalHHS peer review team (PRT), described in Section 8: DDG Governance prior to implementation. The PRT is available to review the department’s documentation to ensure it is consistent with the principles of the CalHHS DDG and meets requirements of the California IPA.
The CalHHS DDG is focused on the assessment of aggregate or summary data for purposes of de-identification and public release. Aggregate data means collective data that relates to a group or category of services or individuals. The aggregate data may be shown in table form as counts, percentages, rates, averages, or other statistical groupings.
Departments are sometimes asked to release record level data. Record level data refers to information that is specific to a person or entity. For example, a record for Jane Doe may include demographics and case information specific to Jane Doe.
However, summary data would include information from Jane Doe combined, or summarized, with data from other individuals. If record level data is to be publicly released, it must be assessed to ensure it is de-identified and does not include Personal Information (PI) or Protected Health Information (PHI). Although the DDG is focused on summarized data, it can be used to assist with review of individual or record level data. The record level data should be assessed both for uniqueness of the records and for the possibility that the data can be used in conjunction with other information available to the requester to identify individuals in the data. Record level data inherently has higher risk than summarized data, even after personal identifiers are removed.
Therefore, record level data for public release should be assessed on a case by case basis.
CalHHS collects, manages and disseminates a wide range of data. The focus for the DDG is on data that includes personal characteristics of individuals who have a legal right to privacy. Personal characteristics include but are not limited to age, race, sex, and residence and other identifiers specified in the IPA and HIPAA and listed in the tables below. These guidelines will focus on the assessment of personal characteristics that are included in various data sets or tables to assess risk for identification of the individuals to which they pertain.
Any information that identifies or describes an individual, including but not limited to:
Name
Social security number
Physical description
Assessing the risk of an unauthorized disclosure that violates an individual’s right to privacy and/or confidentiality, as provided by statute, may be achieved by associating personal characteristics with a person’s identity or attributes. When these characteristics can successfully confirm an individual’s identity in a publicly released data set, then release of this data results in disclosure of personal information.
Less obvious qualities in data sets and elements that may be used to identify individuals or groups can present uniqueness in data. Individual uniqueness in the released data and in the population is a quality that helps distinguish one person from another and is directly related to re-identification of individuals in aggregate data. Disclosure risk becomes a concern when released data reveal characteristics that are unique in both the released data and in the underlying population. The risk of re-identifying an individual or group of individuals increases when unique or rare characteristics are “highly visible”, or are readily accessible by the general public without any special or privileged knowledge. Unique or rare personal characteristics (e.g., height above 7 feet) or information that isolate individuals to small demographic subgroups (e.g., American Indian Tribal membership) increase the likelihood that someone can correctly attribute information in the released data to an individual or group of individuals.
There are a number of variables that are unique to individuals that have been identified in various laws and are considered identifiers (PI/PHI). There are two primary laws that describe identifiers, shown in Figure 1, in California: the IPA and the federal HIPAA. Other variables that are commonly used to publish information to the public have been called quasi-identifiers because while they are not unique by themselves, they can become unique in the right combination. The variables shown in the Publication Scoring Criteria in Figure 6 can be considered quasi-identifiers and will be discussed further in Sections 4 and 6.
The removal of PI and PHI from datasets is often considered straight-forward, because as soon as data is aggregated or summarized the majority of the data fields defined as identifiers in the IPA and HIPAA are removed. However, various characteristics of individuals may remain that alone or in combination could contribute to identifying individuals. These characteristics have been described as quasi-identifiers. Figure 2 helps demonstrate the quasi-identifier concept. For instance, there is interest in reporting about providers, where providers may be individuals, clinics, group homes, or other entities. Each of these providers has a publicly available address and has publicly available characteristics. While patients may come to a provider from anywhere, they typically will visit providers within a certain distance of their residence. Thus, by publicly publishing details on providers, data miners with malicious intent would have a targeted geography that lists locality information, types of services offered and received, and demographic information about patients. To expand on this example, data that states a provider saw two patients with heart disease does not indicate who had the heart disease nor does it reveal the identity of the two patients amongst the thousands of patients that provider sees. However, datasets that display a provider within a given region with two Black or African American female patients under age 10 with heart disease may release enough personal characteristics about the patients to successfully reveal their identity. These compounding patient details released about providers that give geography information (address), health condition (heart disease), and person- based characteristics (quasi-identifiers) of the patients puts the dataset in the overlapping area of the diagram of Figure 2. This overlap, consequently, highlights potential risks associated with seemingly innocent summary data.
It is important to decide your vision and purpose behind your project, and identify what you hope your data project will accomplish. Be thoughtful — what impact do you hope to have? What changes are you trying to bring about? It is worth taking the time to write down your answers to the broader Guiding Questions, as they will be the foundation of your goals and strategic plan.
First, a bit about goals: for your project to execute smoothly, it is best to choose SMART Goals, of goals that are specific, measurable, achievable, realistic, and timely. Look at our summary of the SMART Goal checklist below:
Now that you have identified your goals, you must develop a strategy for achieving your desired outcomes. A Strategic Plan is first and foremost a Roadmap to Success – the more care and thought you put into your plan, the more likely you are to produce a successful data project.
Did you know? CalHHS has its own that summarizes our vision and goals for every department’s products and services. While not a substitute for your strategic plan, it can give you ideas and and helps you ensure your strategy aligns with CHHS’ guiding principles and mission statement.
Utilize a strategic planning framework such as the use case diagram or a logic model. These frameworks will help you explicitly define each step necessary to achieve your goals as well as anticipate what challenges you may face throughout your project.
Find the action words that best describe the work you’ll do: Action words are verbs that describe how you will approach each task in this project. They don’t describe your intended outcome (i.e. increase and reduce are not action words); rather, they describe roles you will take throughout your project to assure a successful outcome.
If you are creating a product:
Update, Upgrade, Develop, Create, Implement, Evaluate, Produce If you are managing a project:
Oversee, coordinate, supervise, manage, plan, support, transition If you are implementing the specifics of a project:
Write, process, provide, maintain, reconcile, direct, administer
This framework is most helpful for projects where you intend to build some sort of system (e.g. website, smart phone app, etc.) that your users must interact with. You also must use a Business Use Case for any data you request using the Data Sharing Agreement form.
A Use Case Diagram will…
Identify the goals of system-user interactions
Define and organize functional requirements in your system
Specify the context and requirements of a system
Model the basic flow of events in a use case
Step 1: Start by defining your actors, or the users that interact with your system. they can be anything from a person to an organization or outside system that interacts with your product.
Note: Think broadly – your users may include institutions both within and outside of CHHS as well as specific populations of the public
Step 2: For each user, list all the ways they can interact with your system (these are the “use cases”) Note: Ensure you consider alternate/undesirable courses of events and use cases that aren’t obvious
Step 3: Draw lines between use cases to reflect commonalities or relationships among them.
Note: Identify the use case with the greatest number of relationships/associations – the most common use cases represent the functions in your project that should be essential.
Also check out this to build your own Use Case Diagram.
The logic model framework focuses on visualizing the relationship between inputs, outcomes, and costs associated with your project. It is a graphical model where each component (or “phase”) of your project relates to a list of intended effects in an implicit, ‘if-then’ way.
The seven “components” you’ll consider are:
Inputs: The resources you need for your project
Activities: What the staff or the program does with those resources
Outputs: Tangible products, capacities, or deliverables that result from the activities
Outcomes: Changes that occur in other people or conditions because of the activities and outputs
To begin, simply create six headers as is shown in the diagram above — this can be done by hand, with sticky notes, or online.
Guiding Questions:
Identifying Impact: What measurable change are you seeking to achieve in the long-term?
Identifying Outcomes: What measurable changes are you seeking to achieve in the short-term?
Identifying Outputs: What tangible outcomes can you measure immediately following the implementation of your product/project?
Identifying Activities: What are some high-level steps you must take to complete your project?
List everything that comes to mind when you answer the those guiding questions above, drawing a box around each entry. Finally, draw arrows between boxes to signify the ‘if-then’ relationship.
The previous Plays provided guidance to improve data-sharing between programs within your department and other organizations. It is equally important to take measures to improve your department’s ability to request and receive data. This Play helps you receive shared data by:
Establishing an environment or shared service to store and consume shared data.
Demonstrate and document security controls when requesting data.
Identify available options to transfer shared data.
This Play can be executed in parallel with other Plays to simultaneously improve your department’s ability to share and receive data. Completing the following Plays helps you develop a business case to secure resources or funding to improve your department’s ability to receive shared data:
Play 1: Establish Data-Sharing Metrics and BUCP Tracking
Play 3: Create a Business Case
This Play does not have a supporting vignette.
A ready-to-use data-sharing environment is a critical technical component of receiving shared data. Identifying gaps in your shared data environment late in a BUCP approval or data fulfillment creates delays. Proactively identifying gaps in your shared data environment provides time to address them ahead of received data.
Some questions to address during your shared data environment assessment include:
Does the environment have sufficient capacity to store shared data?
Is the environment accessible to your department’s staff who will use shared data?
Is the environment sufficiently secure to receive shared data?
Are there any funding restrictions that would restrict the environment’s use?
Create a list of any gaps identified during your shared data environment assessment. Use the list of gaps to work with relevant teams, such as enterprise architecture and information security, to determine resolutions. Since resources to support data sharing are likely limited, create a resolution plan that implements mitigations in the short term (e.g., manual processes) with a plan for full resolution over time.
Use the guidance from Play 3: Create a Business Case to create a business case combined with shared data impacts from the BUCP repository created in Play 2: Identify Your Datasets to identify past data-sharing business results and secure needed resources.
The Center for Data Insights and Innovation (CDII) Agency Data Hub (Data Hub) is an agency- level data-sharing service provider. The Data Hub may be an option that leads to a faster path to receiving shared data than resolving gaps in your internal environment.
The Agency Data Hub is a secure cloud-based data-sharing ecosystem built on a modern platform for data science and analytics. The Agency Data Hub is a collaborative platform that is non-specific to any program or department, where staff across Agency departments and researchers can work together on focused efforts.
For more information on the Agency Data Hub, please contact the Center for Data Insights and Innovation (CDII) at
Data transfer platforms are used to deliver data from providers to recipients. Delays due to data transfer capabilities were cited in several instances during the discovery sessions used to create this Guidebook. Some examples of data transfer technologies include:
Secure File Transfer Protocol (SFTP) for file-based data sharing.
Representational State Transfer (REST) Application Program Interfaces (API) for ongoing data interfaces
Data streaming (e.g., Apache Kafka) for continuous data transfer.
Work with your department’s information technology team to identify data transfer platforms that are available for data-sharing. While creating your BUCP, evaluate your data transfer platforms to verify the following:
Is the platform compatible across data provider(s) and recipient(s)? For example, does the data recipient have the technical capabilities to access shared data via an API?
Does the data transfer platform have network connectivity between the data provider and recipient?
Are there any restrictions (e.g., funding) that prohibit using the data platform technology?
Does the data transfer platform meet information security requirements?
If a suitable data transfer platform is unavailable, consider using shared services including:
The California Department of Technology (SAFE) service is an option. The SAFE service allows for the secure transfer of files over public and private networks using encrypted file transfer protocols (FTPS, SFTP/SSH, and HTTPS).
Although not a data transfer service, the CalHHS Agency Data Hub (Agency Data Hub) is another option to provide data access.
Another option for small-volume datasets with limited security controls is to leverage the State of California Office 365 to use Microsoft Teams for data transfer.
A data provider’s Information Security team may require a review of the controls used to secure sensitive shared data. Creating an inventory of security controls is time-consuming and can create data-sharing approval delays. You can ready your department to receive shared data by proactively documenting the security controls of technical environments that contain shared data. In addition to improving data sharing, this exercise improves your system’s information security posture by:
Establishing alignment with the State of California Statewide Information Management Manual (SIMM) 5300.5.
Identify areas to improve security controls and funding needs.
Providing input to a security roadmap or Plan of Action and Milestones (POAM).
One option is to document the security controls using the National Institute of (NIST SP 800-53) controls. Documenting your security controls using NIST 800-53 provides a commonly accepted set of controls for evaluation by the department providing data. This effort can also improve your data security outside data sharing by identifying needed security control improvements.
For security approvals of “Commercial off the Shelf” (COTS) platforms, such as Office 365 (O365), you can use the NIST Cyber Security Framework (CSFG) 2.0, which is a simplified, summarized control assessment model. The NIST CSF aligns with NIST SP 800-53 and the State of California SIMM.
If you want to provide additional demonstration of your security controls to data providers, your department can engage a third-party assessor to evaluate your security. The California Military Department provides independent .
Sharing your findings with the world is just like telling any good story — sometimes it’s more about the storyteller than the story itself.
All too often, truly meaningful and interesting data projects fall through the cracks because they lack a cohesive narrative or don’t convince the audience why they should care. Remember, it’s up to you to decide how to best leverage your data to tell your story in a way that is compelling, interesting, and true to you. Here are some guiding questions to get you started:
Your data story can and should change based on your intended audience. The contextualizing information you provide, anecdotes you share, or images you include in a professional journal would be completely different from those you’d choose to share to a group of high school science students. Consider the following questions:
What is your relationship to your audience?
Are you their peer? Did you used to be in their shoes? Do you have anything in common?
What can you do to understand your audience?
Create an audience profile for one of your readers/users
Use a word editing app like to improve the readability of your writing
Hemingway will highlight lengthy or run-on sentences, remove overly dense writing, offer alternatives for weak adverbs and phrases as well as poor formatting choices.
Connect to your audience emotionally — how can you make this more personal?
Visualize your story with a storyboard (see
Finding the ‘best’ way to visualize your data takes time and experience — if you’re a beginner, focus your efforts on learning from others and refining your methods to master the art of translating data to diagrams.
|If you just need a quick chart or table, check out these online tools — they are simpler to use than the advanced data visualization guides and may be more appropriate for your specific project:
(interactive charts & simple data tools)
(charts, tables, and maps)
(beginner-friendly, collaborative, focuses on design thinking principles) |
For more complex data projects, choosing the right visualization is more than just deciding between a pie chart vs. a bar graph — it’s about understanding your audience’s learning style and design preferences, leaning in to your creative side, and asking for lots of feedback.
Here are some resources to help you understand all types of data visualization, how to create them, and which choices are most appropriate for your data:
Beginner: summarizing general Data Visualization strategies and common methods used in different professions and sectors
Beginner: : a Definition & Learning Guide with helpful examples
Beginner: This Step-by-Step Guide to Data Visualization and Design written for beginners
Beginner-Intermediate: teaches you how to implement some more basic, powerful data visualization techniques (line charts, scatter plots, and distributions) and how to choose the right one
Getting your message out there requires you to actively share and distribute what you discovered or created.
Important Note: While it may seem as if we believe success is a necessary requirement to any “good” data project, this could not be further from the truth. No data scientists is free from failure, and data projects with less-than-ideal or confusing outcomes — besides being incredibly common — are immeasurably valuable to share with others. As a community, we will never learn from each other’s experiences if we do not communicate our failures.
Across the agency, there are a few existing groups and initiatives that exist to help you leverage your department’s resources to publicize your findings. Take advantage of the resources available to you, ask for help from those who’ve done this before, and be proud of yourself for completing your project!
There are a number of “Data Showcase Teams” across the agency. They organize events to build a shared understanding of data, celebrate successes and failures, and learn from each other’s projects.
Your department or program may have an established visual and brand style that provides credibility to your data analysis, thus increasing its chances of publication. These styles standardize color themes, fonts, and citation formats across agency publications.
A repository of CHHS data assets is currently underway to streamline creation, maintenance, and sharing of each department’s resources.
CalHHS departments and offices are required to engage in an internal review process and obtain approvals for data tables to be published on the CalHHS Open Data Portal. Departments and offices are responsible for driving toward increasing data content, quality, and accuracy, as well as ensuring compliance with all security, privacy, confidentiality laws, rules, regulations, and intellectual property rights requirements. The CalHHS Agency will also engage in strategic planning and approvals as needed.
The CalHHS Open Data Portal governance model takes a multi-level approach that provides oversight in the most efficient/streamlined way possible. Figure 2 provides a graphical representation of the model.
Within each CalHHS department or office a Data Coordinator will lead the data preparatory process. This individual will facilitate initial solicitation for data table suggestions for publication and subsequent preparation activities among the department's centers, divisions and offices. Recommendations for publication of data tables will be submitted from that level to the department or office's strategic level (i.e., the executive leadership team and/or policy committee) for decisions related to data table prioritization and publication. When warranted (based on determination by the department's executive leadership team), approvals will be moved up to the Agency level of governance. This plan constitutes the 'vertical' governance for open data.
The governance model, however, also includes a 'horizontal' governance structure meant to ensure uniform approaches to data publication and standards as a way to facilitate interoperability and sharing among CalHHS department and offices. This portion of the governance model originates at the CalHHS Agency level and centers around team members, representing CalHHS department and offices, serving on the Open Data Workgroup, led by the CalHHS Agency Information Officer.
Each office and department within CalHHS will designate a Data Coordinator. The Data Coordinator should be an individual who:
Has authority equivalent to that of a Deputy Director or the head of a division or office within their department (e.g. Chief Information Officer, Informatics Deputy Director, etc.);
Can identify appropriate persons with comprehensive knowledge of data and resources in use by their centers/divisions/offices/programs;
Assumes responsibility for their department's compliance with this handbook, the , and future directives which may be needed to support the CalHHS Open Data program;
Ensures that guidelines and tools, established by CalHHS governance, are applied to aggregate data for public reporting that: (1) adequately minimizes risk of re-identification, and (2) produce meaningful information (that is, they enable statistically reliable calculations).
The Data Coordinator acts as a liaison between Information Technology staff, departmental programs and leadership, and CalHHS Agency. As such, the Data Coordinator is best positioned to convey to the appropriate parties any specific needs of the Open Data Portal (such as formatting the data or defining a structure that is optimal for publication). Insofar as departments vary in terms of size, functions, and complexity, larger departments may also identify individuals within specific divisions, offices, and/or units to assist the department Data Coordinator.
The executive leadership team and their policy-making committees within CalHHS Departments and Offices will be responsible for ensuring alignment of relevant Department/Office strategic goals with data publication priorities on the CalHHS Open Data Portal. In addition, executive leadership will ensure their Department/Office compliance with this handbook and all approval processes set forth herein (see Department/Office Approvals section below).
CalHHS has established a governance structure that includes an open data workgroup made up of representatives from each CalHHS department or office publishing to the Open Data Portal.
The Open Data Workgroup has the following responsibilities related to Open Data:
Identify and standardize the use and governance of information in support of the missions and strategies of CalHHS Agency and its departments and offices
Develop and maintain controls on data quality, interoperability and sources to effectively manage risk
Identify new kinds, types and sources of data to drive innovation throughout the organization. Define processes for the effective, integrated introduction of new data
Organize and lead the tactical open data governance activities at the CalHHS Agency level to apply four precepts: data principles, standards, policies and guidelines
The executive leadership team within CalHHS Agency is responsible for ensuring alignment of relevant CalHHS Agency strategic goals with data publication priorities on the CalHHS Open Data Portal. In addition, executive leadership will ensure compliance with this handbook among all participating Departments and Offices and provide oversight/approvals as set forth herein (see CalHHS Agency Approvals section below). A key position in the CalHHS Executive leadership team is the CalHHS Agency Information Officer who provides oversight and direction to the Open Data Workgroup and the CalHHS Open Data Portal.
Each CalHHS department and office shall create a catalog of their publishable data and propose a schedule to CalHHS leadership, for making its data available on the CalHHS Open Data Portal. Each CalHHS department and office shall prioritize data publication in accordance with guidelines set forth in this handbook. Formatting of the catalog and publication schedules shall be determined by CalHHS leadership.
For each particular data table, at a minimum, departments and offices must obtain reviews and receive implicit or explicit approval (as applicable) from the individuals listed below. Standardized approval forms must be completed, signed, and a copy of the appropriate form filed with the Data Coordinator's office, prior to data table publication. Departments and offices may determine additional internal approvals and signatures are required, and should include appropriate additional persons in their review and sign-off process (e.g. Public Information Officer).
The department or office Data Coordinator is responsible for obtaining the following minimum approvals from within their department, including any individual internal approvals:
Data Steward: The Data Steward is the person who has the greatest familiarity with and knowledge of the data table, its contents, and the purpose for the collection of the data. The Data Steward should know the accuracy and currency of the data, and be best able to supply metadata elements describing the data. The data steward is responsible for ensuring the overall quality of the data and adherence to publication guidelines that include the creation of metadata, data dictionaries and small cell procedures.
Deputy Director: The Data Steward involves their center/division/office leadership (i.e. Deputy Director) to validate that the center/division/office wishes to proceed with publication of the data table and assumes responsibility for the global review of the data including an evaluation of sensitivities that may be associated with it.
Legal Counsel: Legal counsel will be in the best position to determine, when needed, whether the data table has internally been reviewed sufficiently to ensure compliance with privacy and security requirements, intellectual property rights, and Public Records Act (PRA) responsibilities. Legal counsel may recommend additional consultation with the department's chief privacy officer, chief security officer, and/or public affairs officer.
Data tables may fall into one of three categories as noted below:
Level One: Unrestricted data tables that can be released to the public and published without restriction
Level Two: Data tables that have some level of restriction or sensitivity (see detail below) but currently can be made available to interested parties with a signed data use agreement
Data use agreements between the participating Department and the end-user currently guide the sharing of data.
The CalHHS Data Release Permission Decision Tree can help departments and offices determine a dataset's permission level. Based on review and comments provided by the department, Agency will determine whether the data table will be published on the Open Data Portal.
Armstrong, MP, G Rusthon, and DL Zimmerman, 1999, Geographically Masking Health Data to Preserve Confidentiality. Statistics in Medicine, 18, 497-525.
Bambauer, Jane R., Tragedy of the Data Commons (March 18, 2011). Harvard Journal of Law and Technology, Vol. 25, 2011. Available at SSRN: http://ssrn.com/abstract=1789749 or http://dx.doi.org/10.2139/ssrn.1789749
Benitez K1, Malin B., Evaluating re-identification risks with respect to the HIPAA privacy rule. J Am Med Inform Assoc. 2010 Mar-Apr;17(2):169-77. doi: 10.1136/jamia.2009.000026. http://www.ncbi.nlm.nih.gov/pubmed/20190059
CHHS Open Data Handbook - http://chhsopendata.github.io/ CHHS, Information Strategic Plan 2016.
Colorado Department of Public Health and Environment. “Guidelines for Working with Small Numbers.” Retrieved from http://www.cohid.dphe.state.co.us/smnumguidelines.html
Committee for the Protection of Human Subjects (CPHS), CPHS Bulletin & Update, January, 2005.
Federal Committee on Statistical Methodology, Interagency Confidentiality and Data Access Group. “Checklist on Disclosure Potential of Proposed Data Releases.” Washington: Statistical Policy Office, Office of Management and Budget, July 1999.
Federal Committee on Statistical Methodology, “Statistical Policy Working Paper 22 – Report on Statistical Disclosure Limitation Methodology.” Washington: Statistical Policy Office, Office of Management and Budget, 1994.
Golle, Philippe. “Revisiting the uniqueness of simple demographics in the US population. In Proceedings of the 5th ACM Workshop on Privacy in the Electronic Society. ACM Press, New York, NY. 2006: 77-80.
Howe, H. L., A. J. Lake, and T. Shen. "Method to Assess Identifiability in Electronic Data Files." American Journal of Epidemiology 165.5 (2006): 597-601. Print.
NAHDO-CDC Cooperative Agreement Project CDC Assessment Initiative. “Statistical Approaches for Small Numbers: Addressing Reliability and Disclosure Risk.” December 2004. Retrieved from *7jctjEJXwGDDMepE4_/ Statapproachesforsmallnumbers.pdf
NCHS Staff Manual on Confidentiality. Hyattsville, MD: National Center for Health Statistics, Department of Health and Human Services, “NCHS Staff Manual on Confidentiality.” 2004. Retrieved from .
NORC, “Case Study: The Disclosure Risk Implications of Small Cells Combined with Multiple Tables or External Data,” January 8, 2016.
NORC, “NORC Recommendations for California Department of Health Care Services (DHCS) Data De-Identification Guidelines (DDG),” January 8, 2016.
North American Association of Central Cancer Registries (NAACCR), “Using Geographic Information Systems Technology in the Collection, Analysis, and Presentation of Cancer Registry Data: A Handbook of Basic Practices,” October 2002.
Office of Civil Rights, U.S. Department of Health & Human Services. "Guidance Regarding Methods for De-identification of Protected Health Information in Accordance with the Health Insurance Portability and Accountability Act (HIPAA) Privacy Rule." November 26, 2012. Retrieved from .
Ohio Department of Public Health. “Data Methodology for Public Health Practice.” .
Panel on Disclosure Review Boards of Federal Agencies: Characteristics, Defining Qualities and Generalizability, 2000, Proceedings of the Joint Statistical Meetings, Indianapolis, Indiana.
Privacy Technical Assistance Center, U.S. Department of Education. “Data De- identification: An Overview of Basic Terms.” May 2013. Retrieved from
State of California, Department of Finance, Report P-1 (Race): State and County Population Projections by Race/Ethnicity, 2010-2060. Sacramento, California, January 2013. Retrieved from
State of California, Department of Health Care Services, Trend in Medi-Cal Program Enrollment by Managed Care Status - for Fiscal Year 2004-2012, 2004-07 - 2012-07, Report Date: July 2013. Retrieved from
Stoto, MA. Statistical Issues in Interactive Web-based Public Health Data Dissemination Systems. RAND Health. September 19, 2002.
Sweeney, L. “Information Explosion, Confidentiality, Disclosure, and Data Access: Theory and Practical Applications for Statistical Agencies,” L Zayatz, P Doyle, J Theeuwes and J Lane (eds), Urban Institute, Washington, DC, 2001.
Sweeney, L. “K-anonymity: a model for protecting privacy.” International Journal of Uncertainty, Fuzziness, and Knowledge-Based Systems. 2002; 10(5): 557-570.
Sweeney, L. Testimony before that National Center for Vital and Health Statistics Workgroup for Secondary Uses of Health information. August 23, 2007.
The Centers for Medicare and Medicaid Services, Office of Information Products and Data Analytics. “Medicare Fee-For Service Provider Utilization & Payment Data Physician and Other Supplier Public Use File: A Methodological Overview.” April 7, 2014.
Washington State Department of Health. "Guidelines for Working with Small Numbers." N.p., 15 October 2012. Retrieved from .
The following section describes what the public will view and how the public will be able to use the CalHHS Open Data Portal.
The CalHHS Open Data Portal encourages citizen engagement and participation through the website. The portal provides the capability by which the public can engage via the following mechanisms:
A survey tool asking for feedback about the website usability and data resources,
A dedicated email address by which the public can submit feedback or suggest specific datasets to publish,
An opportunity to join the Open Data listserv to receive updates about CalHHS Open Data, and
A showcase page where useful visualizations and applications created by users can be highlighted.
The CalHHS Open Data Portal supports two classifications of data tables: tabular and geospatial. A tabular data table is a flat file that conforms to a predefined schema. The schema defines the characteristics of a fixed number of columns, including the column name and data type. A geospatial data table contains information that can be readily rendered on an underlying map. Examples of geospatial features include points (buildings), polylines (bus routes), and polygons (school districts), along with attribute information that describes characteristics of each spatial feature.
Data tables can be exported for download in popular human-readable formats, machine-readable standards and streamable file formats. The CalHHS Open Data Portal currently supports the following exportable tabular file formats:
CSV
JSON
Public data often consist of historical archives, comprised of potentially millions of records collected over an extended period of time. The CalHHS Open Data Portal supports the loading, exporting and visualization of large data tables (> 1GB).
The CalHHS Open Data Portal provides an open, standards-based application programming interface (API) to offer automatic access to the published data tables within the open data catalog. The portal's APIs allow the end user to get results back in JSON, XML, RSS, etc. This separation of data model and encoding allows the support of many different encoding standards, even ones that do not yet exist. This enables users to access data in a host of different file formats that are independent of the original format of the data.
The CalHHS Open Data Portal supports the use of an API Strategy that allows the developer community to dynamically query a data table within the data catalog. Each hosted data table within the data catalog will:
be readily and uniformly accessible
be available for automated processing by applications and systems
have a standard API endpoint
All communication with the API is done through an HTTPS protocol. The portal provides the following preferred response types which are made available by specifying the format as part of the URL, or by sending the appropriate HTTP "Accepts" header:
JSON
XML
CSV
RDF
Additionally, the CalHHS Open Data Portal supports the creation of a featured API Catalog that provides custom endpoints to the developer community to dynamically query the data table based on "specified" data table elements. Just like published data tables, the featured API Catalog is categorized and tagged using the common domain and metadata schema. Additional information about the API can be found at .
The Open Data Portal Terms of Use are subject to modification as conditions warrant. When the Terms of Use change, this will be indicated within the Terms themselves with notification of the "Last Modified Date." Therefore, users are required to review the Terms of Use each time they use the CalHHS Open Data Portal for any changes since their last visit. The Terms of Use will always be available on the landing page of the CalHHS Open Data Portal.
Developers and the public are encouraged to develop applications that utilize the data on the CalHHS Open Data Portal. The state may post links to some of these on the CalHHS Open Data Portal, but will not generally be able to evaluate the content, accuracy, or functionality of these mobile applications.
The following table is provided for reference related to the race and ethnicity composition at the county level. It is State of California, Department of Finance, Report P-1 (Race): State and County Population Projections by Race/Ethnicity, 2010-2060. Sacramento, California, January 2013. The table is for year 2010.
Have you interviewed them? Learned their likes/dislikes?
What is your ideal medium?
Your ideal medium is the format through which you implement your product or disseminate your findings, such as:
Digital (web, smart phone applications, social media, etc.)
Formal Print (reports, conferences, PowerPoint/Keynote presentations)
Informal Print (staff meetings, flyers, etc.)
Video
What do you want them to take away?
Is your purpose to share something generally exciting (informational) or do your results inform a specific decision or action (decisional)?
If informational: highlight the findings that are most shocking/interesting to you and your audience
If decisional: present the findings in a way that obviously supports some change or recommendation
This often requires you to contextualize your information — what else should your audience know to reach your conclusion?
Find the right balance between words/explanation and figures/tables/images
This will largely depend on who your intended audience is and what medium you are using — digital products should be more visual while reports or prints should rely more on words
Similarly, balance your quantitative data with qualitative data — too much dry facts or too many numbers may work against a compelling data story
Anecdotes, stories, and contextualizing comments also count
Start with your ultimate goal: What message do you want the audience to walk away with?
Intermediate-Advanced: The Data Visualization Catalogue has a comprehensive list of charts that are separated by what data visualization function they employ
All levels: Coursera often has free online Data Visualization Courses — check to see if one is available!
RSS
XLS
XLSX
XML
Geospatial data contain geographic feature and attribute data that define the properties of geographic features which may be used in a geographic information system (GIS). Attributes are stored in a tabular format with unique key references to the associated geographic features. Two export methodologies are supported for geographic information: geospatial and attribute. Attribute layers can be exported as tabular data file formats (see tabular formats listed above). Geospatial data can be downloaded in any of the tabular formats defined above, as well as the following formats:
.Shapefile
.Keyhole Markup Language (KML/KMZ)
Ann is the Healthy Habits program manager. She started as a student assistant at the CDW 20 years ago and has been a staff member for all the department’s major programs. Ann has strong relationships with department leadership and is an advocate of data-sharing to achieve department objectives.
Samantha is the business analyst for the W2W program. She is knowledgeable about the program but has not worked directly with the W2W data. Samantha is a vital part of the effort by creating business definitions to improve understanding of data meaning.
Linda is a member of the CDW data analysis unit. She works with Samantha to create business definitions, interpret security-related data classifications, and references to statutes that govern data-sharing.
Angelica is the W2W program specialist. She assists Samantha and Linda with creating business definitions when additional program background is required. She also is the primary coordinator with the CDW legal department.
1
Establish Data-Sharing Metrics, and BUCP Tracking establishes a mechanism for your department to track metrics related to data-sharing for process improvements and planning.
2
Identify Your Datasets promotes awareness of your datasets and is a component of downstream Plays.
3
Create a Business Case provides general pointers to secure support from executive approvers and departmental teams needed to execute the Plays.
4
Prioritize Your Data ranks the priority of your datasets to guide investment in data-sharing improvement efforts to focus on datasets that provide the department the most return on their investment.
5
Establish Your Metadata Repository creates a technology platform to house detailed information that describes your data. The repository supports creating the BUCP Technical Fields and provides information for security and statute reviews. After data fulfillment, the repository is used by data consumers to understand shared data.
6
Describe Your Data provides a high-level process to create business definitions, security classifications, and references to governing statutes. This is the core Play that improves data understanding and supporting content for BUCP Technical fields and input for security analysis.
7
Promote Data Awareness suggests ways to build awareness of your data internally and with other CalHHS departments to realize benefits from your investment in data-sharing.
8
Prepare to Receive Data includes proactive efforts you can take to address data-sharing security requirements and infrastructure.


Home address
Home telephone number
Education
Financial matters
Medical history
Employment history
Electronically collected personal information:
His or Her name
Social Security Number
Physical description
Home address
Home telephone number
Education
Financial matters
Medical or employment history
Password
Electronic mail address
Information that reveals any network location or identity
Excludes information relating to individuals who are users serving in a business capacity, including, but not limited to, business owners, officers, or principals of that business.
Names
All geographic subdivisions smaller than a state, including street address, city, county, precinct, ZIP code, and their equivalent geocodes, except for the initial three digits of the ZIP code if, according to the current publicly available data from the Bureau of the Census:
The geographic unit formed by combining all ZIP codes with the same three initial digits contains more than 20,000 people; and
The initial three digits of a ZIP code for all such geographic units containing 20,000 or fewer people is changed to 000
All elements of dates (except year) for dates that are directly related to an individual, including birth date, admission date, discharge date, death date, and all ages over 89 and all elements of dates (including year) indicative of such age, except that such ages and elements may be aggregated into a single category of age 90 or older
Telephone numbers
Fax numbers
Email addresses
Social security numbers
Medical record numbers
Health plan beneficiary numbers
Account numbers
Certificate/license numbers
Vehicle identifiers and serial numbers, including license plate numbers
Device identifiers and serial numbers
Web Universal Resource Locators (URLs)
Internet Protocol (IP) addresses
Biometric identifiers, including finger and voice prints
Full-face photographs and any comparable images
Any other unique identifying number, characteristic, or code


Reduce something (e.g. reduce number of smokers in California)
Impacts: The most distal/long-term outcomes
Assumptions: Your beliefs about the program and the resources involved (including how successful you you think it will be or the challenges you may face)
Moderators: Contextual factors that are out of control of the program but may help or hinder your efforts. These may influence participation, implementation, achievement of your outcomes.


Evolve and institutionalize behaviors for the appropriate use of information within changing privacy needs, ethical values, societal expectations and cultural norms
Define, manage, and control master data and metadata management policies, controls, and standards, including reference data
Department/Office Director or Designee: The head of the department or office (or their designee, such as the Data Coordinator) ensures full knowledge within the State entity that the State entity is providing a data table to CalHHS Open Data under full authority to do so. It also serves as the ultimate internal control to exercise authority within the State entity ensuring that proper evaluations of the data tables have been completed.
Data tables with a higher level of sensitivity defined by:
Sharing the data has not been mandated by the Legislature, an auditing entity, or other entity outside the participating Department.
The data table has implicit or direct policy implications.
The data table is likely to attract media attention (either positive or negative) or is subject to ongoing media interest.
There is legislation pending or recently passed related to the data table. A legislator has held or scheduled hearings on the content area of the data table. The data table will likely attract legislative interest.
There is pending enforcement action or litigation related to this data table.
Level Three: Level three databases are highly restricted due to HIPAA, state or federal law. These data will NOT be accessible through the CalHHS Open Data Portal.


California
Alameda
For data to be valuable, it must be understandable by data consumers and your internal teams. Metadata or “data that provides information on other data1” provides the technical, business, and security information needed for consumers to work with your data. Metadata also provides input to complete the BUCP Technical Fields and support analysis for the Specialized Security and Specialized Privacy fields. Metadata contains the following types of information:
Business Definitions
Technical Information
Security Classification
Governing Statutes
The term “metadata” may not be familiar to your data consumers. When explaining the purpose of your metadata repository it may be more effective to use common language terms or descriptions such as “data definitions” in place of “metadata”.
This diagram depicts your metadata repository and its consumers across your department’s various teams:
Metadata Repository Consumers
Typically, metadata is stored in a repository and presented to data consumers in the form of a data dictionary. A data dictionary helps data recipients, such as departments receiving your data, understand the meaning of individual data elements.
Once your metadata repository is populated, you will have a data dictionary for data consumers to understand the meaning of individual data elements and support the following components of BUCPs:
The content for the Technical Fields section.
List of governing security statutes for analysis to complete the Specialized Security and Privacy Fields.
List of governing statutes to understand data sharing requirements and limitations.
Your metadata repository also provides direct benefits to your department that are listed below and elaborated in the Guidebook’s supplemental section Benefits to Your Department from Executing the Plays:
Internal data-sharing
System changes
Impact assessments
Level of effort estimates
We recommend launching the effort to create your metadata repository in parallel with the data prioritization effort described in Play 4: Prioritize Your Data. Conducting these efforts in parallel provides time for the implementation of a data catalog product or for technology teams to implement an alternate solution using an existing database.
Describing Your Application Program Interfaces
The techniques to improve data-sharing provided by this Guide are relevant to data stored in databases and Application Program Interfaces (API). If your data-sharing improvement effort includes API, please review the Guidebook’s supplemental section Describing Application Program Interfaces for guidance on related metadata standards and practices.
Your first step is to identify the type of information to be captured in your dataset’s metadata. Typically, metadata is captured at the field or attribute level and includes the following types of information:
Field Name
Field Label
Data Type
Field Definition
The attached metadata template provides an example of the types of metadata to collect. You can tailor the metadata attributes in this example spreadsheet to your department’s needs.
Collect sufficient data to convey the meaning of your data and analysis during BUCP approvals. Remove metadata attributes that are not relevant to your datasets to reduce metadata collection and maintenance efforts.
Additional examples of data dictionary templates are listed below:
The next step is to identify the technical platforms that store your datasets for use during your metadata repository selection process to identify technical attributes to include in your metadata repository. These are typically your department’s databases but can also include Application Program Interfaces (APIs) or datasets created by your analytics platforms. Use the dataset inventory you created in Play 2: Identify Your Data to identify technology platforms.
Depending on available resources, options to create a data catalog and metadata repository include:
Commercially licensed software packages
Open-source software packages
Use a database to capture metadata
Spreadsheets
Open-source and commercial metadata repository platforms include features for automated data element collection and web-based access. Metadata repository platforms save time in the maintenance of your data dictionary and improve access to metadata. Data catalog platforms also make it easier to manage custom metadata, including references to applicable statutes that govern data sharing. Data catalog platforms also promote the use of your data-sharing artifacts by improving access through web access and search functions.
The Guidebook supplemental section, Example Metadata Repository Tools, provides examples of data catalog tools, including those available (e.g., AWS, Azure, Google) via the State of California contract vehicles.
Use the requirements you created in Play 5.1: Identify Metadata Requirements to evaluate the identified options and make a platform selection. If you do not have budget or staff resources available to establish a data catalog platform, you can get started using existing tools such as your department’s databases, spreadsheets, and a collaboration platform (e.g., Microsoft Teams).
Spreadsheets avoid software license and infrastructure costs; however, they are time-intensive to maintain and use for large datasets. If funds are unavailable to support a commercial platform or host an open-source option, another strategy is to use one of your existing databases as a metadata repository. Most database platforms provide the ability to store descriptions and security classifications-based metadata. Using your database platform’s metadata features lets you:
Integrate ongoing creation and updates of metadata into your development processes.
Create reports for data consumers using SQL statements.
Establish a source of metadata for Data Dictionary platforms.
Database platform metadata capabilities may only track a limited quantity of metadata fields. You will need to develop an approach to address such limitations. For example, your approach may need to combine security and legal statute references into a single field.
Later in the Play 5 vignette, we provide an example of using a database as a metadata repository.
Data recipients who receive your metadata may have difficulty understanding your department’s use of specific terms and specialized meanings.
A business glossary extends context and understanding of your data definitions. A business glossary defines business concepts that are required to understand your data definitions. An example of a web-based business glossary is available . Your business glossary can be a worksheet in your metadata package transmitted to data recipients.
At a high level, a business glossary establishes a record of your department's or program's jargon-specific use of terms and acronyms. Some examples of items to include in your business glossary include:
Terms specific to your department
Specialized use of terms
Acronyms specific to your department
You may already have the beginnings of a business glossary in your new employee onboarding library.
Spreadsheets are a simple mechanism to store your department’s business glossary if a data catalog platform is not available. A website improves accessibility if your department receives frequent data requests or actively publishes data on open data portals.
If your department has elected to implement a metadata repository tool or you are electing to use a spreadsheet, feel free to skip this vignette.
The CDW lacks the funds to purchase a data catalog for its metadata repository tool. When the data-sharing improvement effort is successful, Sally will try to secure funding for a data cataloging tool in the next fiscal year.
Carlos’ background as a database administrator helps solve the funding problem. He suggests using tools CDW already owns, including the department’s database and collaboration platform, Microsoft Teams. First, the CDW will use a combination of spreadsheets and description fields in their databases to collect and store their metadata. These tools provide automation that help scale the effort for the rest of the department’s datasets. Carlos’ metadata management process is depicted below:
The high-level metadata collection and storage steps are as follows:
Create the Initial Data Element Inventory: Carlos runs a Structured Query Language (SQL) to extract the list of fields from the W2W database in a Comma Separated Value (CSV) format.
Carlos places the file on the CDW’s collaboration platform, Microsoft Teams. The collaboration platform lets the CDW staff add metadata to a central file.
Collect the W2W Metadata: The CDW staff add supporting metadata, including:
Carlos documents the plan for review with the W2W development and database teams. Sally schedules a meeting with the W2W development lead and its DBA to review the plan. During the meeting, Sally and Carlos use the following agenda:
Departmental Objectives
Executive Support
Benefits to the W2W Technical Teams
Metadata Repository Approach
The W2W IT team lets Carlos know that they recently upgraded their database version. The new database version provides standard metadata fields for descriptions and security classifications.
Sally, Carlos, and the W2W development team agree on the approach and scope of a proof-of- concept to test its viability and gather lessons learned to improve the process. The group also agrees on how the metadata collection team will engage IT resources. The agreement helps ensure the IT staff can complete their daily job duties while supporting the metadata collection effort.
Sally decided to use a simple spreadsheet stored in Microsoft Teams for the CDW business glossary. The business glossary will be incrementally populated as the CDW data team populates the metadata repository.
Benefits to data sharing and success stories.
Cataloging your department's datasets and capturing their metadata benefits external data recipients and your organization's analytics, application enhancement, and information security teams. You can use this section during the execution of the Plays to:
Secure executive support by showing internal benefits and bolstering the business case for the data cataloging effort.
Gain buy-in from the internal teams that are needed to support the effort by demonstrating direct benefit to their efforts.
Support the business case for the acquisition of data management tools.
The Data-Sharing Plays provides benefits for internal data-sharing between your department’s programs. Your data catalog creates awareness across your department’s programs of available data and points of contact to coordinate data-sharing agreements.
Like external data-sharing, providing data between programs within your department may require agreements and security approvals. The detailed metadata created by executing the Plays provides detailed security classifications for compliance and verification of security controls. Participation by your department’s information security team in classifying data also builds familiarity and expedites security reviews.
Additionally, data recipients from other programs may not be familiar with your data. The metadata catalog and business glossary created by executing the Plays foster understanding and the ability to accurately use data from other programs.
Your department's report and analytics creation efforts benefit from improved and comprehensive metadata by:
Reduce Report Development Time: The inventory of data elements and their definitions allow your staff to create reports/analytics more quickly by:
Avoiding time spent on researching data element meaning.
Easy access to an inventory of your department's data.
Providing support materials to explain report/analytics methodologies.
Creating your data catalog also addresses State Administrative Manual (SAM) Item 4, requirements for Agencies to maintain an enterprise data inventory.
Having a detailed inventory of data elements and their data security classifications also benefits information security. The inventory of data elements and classifications provides the following:
State Information Management Manual (SIMM) Requirements: SIMM 5305-A, through a reference to the Federal Information Processing Standards (FIPS) 199, requires that data maintained by the State of California maintain data classifications and other metadata.
Requirements: SIMM 5305-A, through a reference to the , requires that data maintained by the State of California maintain data classifications and other metadata.
Complete List of Applicable Security Requirements: The regulatory and department- level security requirements will vary by data element. Classifying each data element provides the information to establish the required data security controls. For example, some data elements may be subject to the / Health Information Technology for Economic and Clinical Health Act (HITECH). Other data elements may contain Personal Identifiable Information (PII) subject to .
The data catalog established by executing the Plays also benefits your department's application development teams. The inventory of data improves the efficiency of system enhancement efforts by:
Reduced Design and Development Time: Your enriched metadata minimizes the time to create new application and database system changes through:
Data Architecture Design: The data catalog allows design staff to create database specifications more quickly through a consolidated view of existing data elements. The data dictionary format also provides a mechanism to communicate database specifications to developers.
Data Element Identification: The data catalog improves the ability to create mappings between your system's data tier with user interface (UI) and data interfaces (e.g., External Interfaces). The data catalog reduces the time to create thorough technical specifications.
Creating a data catalog also helps future modernization efforts by providing inputs to current state analysis and data conversion. A comprehensive inventory of data elements and their descriptions is one input to assist with planning modernization efforts by:
Provide a source of requirements for new data platforms.
Improve the accuracy of level of effort estimations for the data-related portions of a new system, including:
New system data architecture design and implementation.
Data migration/conversion efforts.
The data architecture artifacts created during the data cataloging effort support aspects of the including:
Mid-Level Requirements
Data Conversion Plan
Reference Architectures (Data Architecture)
CalHHS Data-Driven Success Stories demonstrate how we leverage data and technology to improve services to Californians and become more client centric. The stories aim to create awareness of innovative ideas and improve interdepartmental coordination by providing a platform to collaborate, share ideas, and expand CalHHS’s data culture.
Former CalHHS Secretary Mike Wilkening and USC researcher Emily Putnam-Hornstein discuss the Record Reconciliation Project at the 2018 Data Expo. The goal of this project is to link and organize administrative, client-level records to improve statistical analysis of CalHHS clients. This CalHHS-USC collaboration is helping to break down program siloes and create a more holistic view of clients and their cross-program experiences.
Marko Mijic, Former CalHHS Deputy Secretary, explains how bringing data together, streamlining data management processes, and mapping data with a dashboard helped to support timely decision-making and response to California wildfires.
The California Health and Human Services Agency (CalHHS) Data De-identification Guidelines (DDG) describes a procedure to be used by departments and offices in the CalHHS to assess data for public release. As part of the document, specific actions that may be taken for each step in the procedure are described. These steps are intended to assist departments in assuring that data is de-identified for purposes of public release that meet the requirements of the California Information Practices Act (IPA) of 1977 and the Health Insurance Portability and Accountability Act (HIPAA) to prevent the disclosure of personal information.
Additionally, the DDG support CalHHS governance goals to reduce inconsistency of practices across departments, align standards used across departments, facilitate the release of useful data to the public, promote transparency of state government, and support other CHHS initiatives, such as the CalHHS Open Data Portal.
The CalHHS Data De-Identification Guidelines are divided up into multiple sections. The sections can be navigated using the list on the left side of this page or by clicking one of the section links below:
This section explains the characteristics of effective data definitions and an approach to developing data definition skills across your team. Even if you have experience in this area, this guide helps develop data definition skills for the team members participating in the metadata collection effort.
The incentive to create effective definitions is that your staff spends less time fielding questions from data recipients. Additionally, an accurate understanding of data translates to more precise analytics that inform program, department, and agency-level decisions.
Some data element meanings are apparent and straightforward to define. Others have a very specific meaning in the context of your department's business and can be more difficult to define.
Creating effective data definitions may sound intimidating, but creating effective definitions just takes practice. Building any new skill takes a few rounds of
If Step 3 determined that the data set has a risk that small numerators or small denominators may result in conditions that put individuals at risk of being re-identified, then the data set must be assessed to determine the need for statistical masking of those small values and complimentary values. In performing the statistical masking, the data producer must consider what level of analysis may be sacrificed in order to produce a table with lower risk. Initial considerations for statistical masking are described below. For additional methods related to statistical masking, please see .
If there are more dimensions present in the table than necessary for the vast majority of analysis, the data producer should consider reducing the number of dimensions in a single table and produce multiple tables each with a subset of the dimensions in the table that resulted in small cells. For example, if there are six dimensions of interest for study, but a table that crosses all six dimensions produces a large number of small cells, the data producer could consider producing several tables each of which crosses four dimensions. This is especially effective if there are very few analytic questions requiring a cross section of all six variables.
Alpine
Amador
Butte
Calaveras
Colusa
Contra Costa
Del Norte
El Dorado
Fresno
Glenn
Humboldt
Imperial
Inyo
Kern
Kings
Lake
Lassen
Los Angeles
Madera
Marin
Mariposa
Mendocin o
Merced
Modoc
Mono
Monterey
Napa
Nevada
Orange
Placer
Plumas
Riverside
Sacramento
San Benito
San Bernardino
San Diego
San Francisco
San Joaquin
San Luis Obispo
San Mateo
Santa Barbara
Santa Clara
Santa Cruz
Shasta
Sierra
Siskiyou
Solano
Sonoma
Stanislaus
Sutter
Tehama
Trinity
Tulare
Tuolumne
Ventura
Yolo
Yuba
An alternative approach to addressing small cells in a table is to reduce the number of levels of a particular dimension. This is especially useful for dimensions with a large number of levels that can be easily aggregated to fewer levels and maintain much of their utility. Geographic variables such as state or county can often be recoded into regional variables that still serve the analytic needs of the data user. It is also the only table restructuring option for tables with only two or three dimensions which have limited opportunities for table dimension reduction.
It should be noted that these actions can be used alone or in tandem to reduce, or completely eliminate, small cells within a table.
There will be cases where not all small cells can be eliminated by reducing granularity of dimensions or the number of dimensions present in a table. In these cases it will be necessary to suppress small cells and perform complementary suppression to ensure that precise values of small cells cannot be calculated using the values of unsuppressed cells and marginal values. In the simplest case this means ensuring that each column and row of a two dimensional table has at least two suppressions. This ensures that the precise values of the suppressed cells cannot be calculated. Complementary suppressions are often selected using one of the methods listed below.
The ‘analytically least interesting’ level of a particular dimension. This is often, ‘other’, or ‘I don’t know’.
The smallest cell available for complementary suppression. This is based on minimizing the ‘information loss’.
The cell most similar to the cell needing complementary suppression, such as adjacent age groups. This can produce complementary suppression that may be easier to interpret.
Verifying security controls
API and data set reuse
Source
Security and Privacy Information (e.g., Personal Health Information (PHI) or Personally Identifiable Information (PII), Related Statutes)
Related Governing Statutes or Codes
The CDW security team reviews the elements and their definitions to create security classifications for the W2W data. The security team creates a set of standard classifications to help identify the security requirements for shared data, including:
Personal Identifiable Information (PII)
Protected Health Information (PHI)
CDW Institution Codes Related to Data Security
Load the Metadata: The CDW database administrators create SQL-based Data Definition Language (DDL) statements that load the definitions into the W2W database. Carlos makes an Excel macro to automatically generate the DDL from the spreadsheet used to collect metadata.
Extract the Metadata: The W2W development team adds a step to their process to include definitions whenever they make database changes. This process keeps the W2W metadata complete and current. As the W2W database is modified, Carlos runs the SQL statement from Step 1 to extract the metadata.
Publish Metadata: Carlos places the resulting CSV in Microsoft Teams. The W2W database is the source of truth for metadata. The metadata spreadsheet in Teams is read-only to ensure all metadata changes are performed through the CDW development processes. He sends an email to notify data consumers that a new version of the data dictionary is available.


Reduce New Staff Ramp-Up Time: Without data architecture artifacts, including your data catalog, staff must learn the meaning of data through research and with the support of existing staff. Access to the data catalog allows new staff to know your datasets in a self-service manner and without time spent sifting through documentation.
Improve Report Accuracy: Access to the data element's meaning helps select the correct data during report/analytics creation. Additionally, a common understanding across report creators promotes alignment and accuracy across your department's reports.
Improve Cross-Program Analysis: The understanding provided by your department's data catalog improves cross-program analysis by:
Helping data elements to link data across datasets (e.g., Identifiers).
Normalizing data by ensuring combined data has the same meaning.
Input for Role-Based Access Control (RBAC): An inventory of data elements is the foundation for establishing an RBAC based on least privilege. The inventory of data elements is used to map elements to user roles to implement data access that restricts access while allowing users access to data needed to work effectively. The inventory of data and its classifications is used to implement fine-grained controls such as record and attribute level security.
Data De-identification: Data classifications and definitions are inputs for implementing data de-identification for datasets provided to internal users and external data recipients. Data de-identification eases data sharing by reducing risk. De-identified data may also expand the pool of internal staff to support analytics efforts through reduced security risk exposure.
Data Element Re-use: The ability to quickly review data elements promotes re- use and accidental introduction of duplicate fields.
Impact Analysis: When extended with mappings to UI and data interfaces, the data catalog improves the ability to identify the impacts of system change. Accurate impact analysis helps project planning efforts and reduces the risk of introducing unanticipated impacts.
Level of Effort Estimates: The inventory from the data catalog provides an input to data-related level of effort estimates.
Reduce New Staff Ramp-Up Time: Like reduced staff ramp-up time for analytics efforts, your application development teams benefit from the metadata catalog. Application and database developers can learn your data architecture more quickly using your metadata catalog.
Document the data portions of the current state system to supplement procurement (e.g., Bidder's Library)
The steps to create effective data definitions are summarized below:
Incrementally create a list of your department's business terms (i.e., Business Glossary).
Select a sample of data elements with meaning that is contextually specific.
Use the sample to create a set of practice definitions and review them with a team member.
Incorporate the reviewer's feedback and practice again until you feel comfortable with the practice of creating definitions.
The examples in this guide depict creating database field definitions but apply to creating Application Program Interface (API) attribute definitions.
There is no specific or "right" format for a data definition; the measure of success for a data definition is whether it can be easily and quickly understood. To this end, George Washington University’s (GWU) Business Intelligence Services provides actionable guidance on creating effective data definitions in "Creating Good Data Definitions." We recommend reading this information and saving it as a reference for use during your metadata collection and data definition effort.
The steps in this section provide a suggested approach to practicing your data definition skills. This approach is adaptable to your learning style. The main point is to practice and validate your definitions until you feel comfortable moving forward. Inaccurate or incomplete data definitions limit the effectiveness of your data. Some focused practice up front pays dividends in the future.
Here are the steps to develop practical data definition skills:
Start your practice by selecting two data element sets to practice your definition skills.
We recommend that the first set of data elements have an apparent definition to establish base skills and expand those skills. This set is used to practice foundational aspects of creating definitions and build confidence in your abilities.
Identify a second set of data elements that will be more challenging to define. Some characteristics that make a definition more challenging include:
Expansive meaning of the data elements
Inclusion of units of measure (e.g., Time)
Description that is specific to your department
For each of your sample data elements, create a definition that is:
Clear: precise, concise, and unambiguous. Allows only one possible interpretation
Specific Concept: includes the essential meaning or primary characteristics of the concept
Primary Definition: Does not contain any embedded definitions or underlying concepts of other data elements
Defined without Circular Reasoning: Is not defined in terms of another data element
Expressed without Rationale, Functional Usage, Domain Information, or Procedural Information: Does not include statements about why and how a data element is used.
After you create your practice definitions, take a step back and assess each of them by asking yourself the questions below:
Would I understand this definition if I were a new team member unfamiliar with our department's terms, program names, and other peculiarities?
Is the subject of the definition clear and specific?
Is the definition concise? Can I quickly understand the data's meaning?
Can I use this definition for data analysis? Does it specify the required units of measurement, if applicable?
Based on your self-assessment, make needed adjustments, and ask these questions again. Once your definitions have passed a self-assessment, it's time to get feedback from a peer.
A definition may be clear to you, but ambiguous to others. Peer reviews capture others' interpretations to ensure the data definitions are understandable for as many data consumers as possible.
Schedule a meeting with a team member to review your practice definitions. After they have reviewed your practice definitions, ask them to state their understanding of the data elements. If the meaning wasn't clear to your team member, adjust and present it again in the same session. Iteratively capturing feedback for adjustments builds your data definition skills and improves understanding.
When possible, conducting this exercise with another team member is an informal training opportunity to enhance their familiarity with data definitions and authorship.
Peer reviews inevitably add time to the effort, but as your data definition skills improve, they may only be needed when you are unsure of the clarity of a data definition.
Encourage the team members who create data definitions to use this guide to refine their skills in defining and refining data definitions iteratively. A collaborative workshop allows team members to learn and practice new skills together and develop confidence. A sample workshop agenda is presented below:
Inform your team of the characteristics of effective data definitions.
Review the techniques to practice data definition skills.
Conduct a collaboration session where attendees develop definitions, review them with other attendees, and iteratively incorporate improvements.
Feel free to adapt this agenda and skill-building approach to the needs of your team.
This vignette describes the process of creating initial data definitions and refining them to maximize their clarity. The examples are based on the department, the California Department of Wellness (CDW), and the Walk 2 Work (W2W) program. The vignette finds Sally practicing her data definition skills and coaching her team during the CDW’s effort to enrich the W2W dataset metadata (Play 4: Describe Your Data, Vignette).
Sally reads George Washington University’s “Creating Good Data Definitions” to understand the characteristics of effective data definitions. She prints the summary of data definition key characteristics and hangs it in her working area as a quick reference.
Sally creates a template for the business glossary in Microsoft Teams, the CDW’s collaboration platform. The business glossary is a tab in the data dictionary that defines the terms specific to the W2W program.
To practice her skills, Sally selects a small set of data elements to create definitions. The data elements relate to the business term of a “Stop” on a W2W participant’s commute. Sally selects the following data elements to practice her definition skills:
Geocode: Sally selects this element because existing industry standards for geolocation data partially define its meaning.
Location: She selects this data element because its meaning is expansive, and it is a critical data element for many program data analysis efforts.
Address: Sally selects this data element for her practice efforts because its meaning is apparent, but it is a good starting point for building foundation skills for definition structure.
Duration: Sally selects this data element because it contains a time-based unit of measure and is vital for W2W case processing Key Performance Indicators (KPIs).
Geocode
Stop Geocode
The geocode of the stop.
The definition is missing the geocode format.
Location
Location Where Stopped
A Location that is part of the commuter’s route.
Is this a business, cross- street, etc., during the walk to work?
Address
Address
The address associated with the Location.
Sally then adds the business term “Stop” to the CDW business glossary.
Stop
A planned stop on a participant's commute, such as visiting a business, park, or time spent transitioning between modes of transportation (e.g., Light Rail Station). A stop does not include unplanned stopping points, such as waiting at a traffic light or crosswalk.
The new term in the business glossary provides additional context for the data element definitions related to this business term.
The business glossary helps inexperienced staff and external data recipients understand the W2W business. It also allows for re-using the business term across multiple data elements.
Next, Sally updates the data definitions for these three data elements. She performs a self-assessment of the definitions and makes some adjustments to improve the specificity of Location and Duration.
Geocode
Stop Geocode
The geocode of the stop in decimal- degree format.
Location
Location Where Stopped
A Location (e.g., Business) where the participant stopped during their commute.
Address
Address
The street address of a Location.
Duration
Duration in Minutes
After improving the definitions, Sally schedules a peer review with Claudia, a business analyst who recently joined the W2W team. Claudia will be helping the team define the business aspects of the W2W metadata. Working with Claudia allows Sally to get feedback and build another team member’s understanding of the W2W data.
Claudia’s understanding of Location and Duration was mostly but not entirely correct. Sally adjusts the definition and asks Claudia to provide her understanding based on the new definition. With the new definition, Claudia now has a complete understanding of the data element.
The updated definitions are entered into the data dictionary:
Geocode
Stop Geocode
The geocode of the stop in decimal- degree format.
Location
Location Where Stopped
A Location with a registered USPS address (e.g., Business, Residence, Park) where the participant stopped during their commute.
Address
Address
The street address of a Location composed of address number, street name, and street type (e.g., Street Road, Avenue).
Duration
Duration in Minutes
Sally schedules a data definition training workshop with the team conducting the metadata collection effort. The workshop helps spread data definition skills across the team. She reviews the characteristics of effective data elements with the team. Sally has pre-selected a set of simple and challenging-to-define data elements for each workshop participant. As a group, they create definitions and perform a peer review with another participant.
Sally encourages the team to practice on their own before the kickoff of the metadata collection effort.
Improving your department’s ability to share data is a team effort. It requires support from department executives to allocate program, technical, and security resources. This Play provides general guidance on obtaining executive support by creating a business case for improving data-sharing. This Play focuses on creating a business case for data-sharing improvements that support department and program objectives by defining:
Benefits to your department
Required staff resources
Required technology resources (e.g., Data Catalog, Metadata Repository)
High-level implementation plan
We recommend positioning an incremental effort to minimize the department’s upfront investment and deliver benefits to sustain continued executive support. As the value of data- sharing is demonstrated, it becomes easier to gain executive support to improve sharing capabilities for additional datasets.
It’s incredibly supportive to have a coach to help create and communicate your business case. It is crucial that your coach is integrated into business operations and can help you communicate data-related concepts in a manner that is relatable to executive management. Your coach may also be a source of historical data-sharing efforts and benefits to bolster your business case.
Your coach is a sounding board to help you link the data-sharing benefits to the department’s objectives and ensure the business case is clear. Depending on their position, your coach can advocate for investment in data-sharing with executive management to further support data- sharing improvement. Your coach may also be willing to review your business case presentation to suggest improvements.
Ideal candidates are members of program management who understand the benefits of data- sharing or information technology staff with solid program knowledge and data expertise. Your coach may end up being a team of coworkers filling a specific role.
Sally has never created a business case before and is feeling overwhelmed. During the effort to inventory the CDW datasets, Ann, the Healthy Habits program specialist, provided significant insights into data-sharing's importance in realizing departmental objectives. Sally decides to ask Ann if she will be her coach while creating the business case to improve data sharing. Ann agrees and will help Sally identify benefits and review the business case before presentation to CDW executive management.
Ann provides Sally with some useful information on how the effort will help the department and the Healthy Habits program including:
Healthy Habits would like to establish an inter-department data-sharing from the Walk 2 Work program to determine outcomes and new services to participants in both programs.
The Healthy Habits data analysts have noted that it’s difficult to understand the system’s data which impedes creating analytics needed to optimize the program.
The CalHHS IT and Data Strategic Plan embraces data-sharing as a facilitator of its strategic objectives.
Sally takes notes on her conversation with Ann for inclusion in the data-sharing improvement business case.
Improving data-sharing is an incremental effort that will take time and resources. This Play supplements the CalHHS , by guiding how to create a business case for investment in data-sharing capabilities. The first step in creating the business case is identifying some high-level benefits created by an investment in data sharing.
The BUCP tracking repository you created in is a source of department-specific information for your business case. Review the BUCP tracking repository to identify the following to include your business case:
Departmental and program benefits from previous data-sharing efforts
Impediments to data-sharing that are resolved by the investment in data-sharing improvements.
Pending BUCPs under approval that will benefit from the data-sharing improvement effort.
Your department might already have an established data-sharing initiative. If so, you can link your resource request to the existing initiative. The remaining portion of this Play can help you elaborate on an existing data-sharing initiative with specific benefits to your department’s objectives. If your department doesn’t have a directly stated initiative to improve data-sharing, there are potentially indirect references in department and program objectives and plans. For example, cross-program coordination indicates a need for data-sharing.
Sally begins her research to capture the benefits of data sharing. Sally reviews the strategic plan for the department and its three main programs. She learns that there is an initiative to expand cross-program services for the Walk 2 Work and Your Environment participants. This initiative indicates that improving data-sharing capabilities will benefit these two programs.
She also reviews the CDW BUCP tracking system to identify benefits and outcomes from past data-sharing efforts. She identifies an example of how the Your Environment program used data from the Department of Volunteer Services for marketing and outreach, creating a five percent expansion in program participation over six months. This provides a quantifiable demonstration of the value of data sharing.
Sally adds these examples of data-sharing benefits to her business case and supporting presentation.
Improving your ability to share and receive data requires staff support from multiple teams within your department. Your effort requires support from the following internal teams:
Information Technology
Business Analysts and Other Program Staff
Information Security
Legal and Legislative Analysis
Obtaining their buy-in is a critical success factor for your data-sharing improvement effort. Your data-sharing improvement effort benefits your department, incentivizing the required staff teams to participate. Your business case also helps secure support from executive management to engage the needed staff resources.
The Guidebook’s supplemental section, , explains the departmental benefits of executing Data-Sharing Plays. You can use the supplement as a starting point to identify benefits for your department for inclusion in your business case and garner support from the teams required for your data-sharing improvement effort.
A summary of the internal benefits to the department and teams required for the effort include:
Internal data sharing within the department.
Improving the quality of the department’s analytics by further understanding of the department’s data.
Additional visibility for the information security team of the department’s data classifications for risk assessments and refinement of security controls.
Include the benefits to internal department teams in your business case to secure support from required teams and approval from executive management.
You may want to schedule short meetings with leadership from the required teams to provide a brief overview of the effort and benefits to obtain preliminary support ahead of your presentation to executive management.
Sally summarizes the department benefits to the CDW in her business case and supporting PowerPoint presentation. She summarizes these benefits using the Guidebook’s supplemental section as a starting point. Sally creates the following summary of the benefits identified during her research:
The Healthy Habits and Your Community programs are interested in establishing an inter-department data-sharing agreement to obtain data from the Walk 2 Work program. Like a BUCP with another department, the effort will help with data-sharing within the CDW.
Other departments frequently request data from the Healthy Habits program. The CDW data team spends significant time supporting these data-sharing agreements. Additionally, once data is shared, the CDW data analysts spend time answering data recipient questions.
The Healthy Habits system was developed in the early 2000s. The system’s database has been enhanced for over 20 years, but the data architecture documentation is outdated. The data-sharing effort will resolve difficulties in making database and application changes and make report creation more efficient.
Later in , Sally and the team will identify additional benefits as they learn more about the department’s data and initiatives.
The data-sharing improvement effort requires support from teams across your department. Your business case should have a resource plan that provides management with the information needed to approve the initiative. Identifying resources ahead of your effort also allows you to proactively engage supporting teams to develop a resource plan and schedule that accommodates regular job duties.
Data Prioritization Staff Resources
The Plays provide an iterative approach to incrementally improve data-sharing through a prioritization process. Further described in , you will need to work with staff members with decision-making authority to provide input into a rubric to prioritize your department’s data.
Your resource plan should include staff to support the prioritization effort. You can read to learn more about the recommended data prioritization approach to create a staff request in your business plan.
Data-Sharing Improvement Staff Resources
After selecting your priority datasets, in you will improve data understanding and the ability to process BUCP security and privacy requirements by enriching dataset descriptions (i.e., Metadata). Describing the priority datasets is a multidisciplinary effort that requires the following staff support:
Access to data subject matter experts to enrich your dataset’s business definitions.
Time from information security to mark data with security classifications.
Support from information technology to store the department’s data catalog.
Access to your department’s legal team to identify statutes that govern data sharing.
Technology Investments
In addition to staff resources, your effort may require technology investments. For example, using a metadata repository tool reduces staff time to collect and maintain your department's data inventory and descriptions. Data catalog tools also provide the capability to maintain description and metadata on datasets beyond those stored in your database, including API and analytics-based datasets. The benefits provided by metadata repository tools are further described in the Guidebook’s supplemental section .
You may also find that technology investments are needed to improve your BUCP tracking, and document repository created in . Include software and infrastructure costs required for the data-sharing improvement effort in your business plan.
With the benefits of her proposal defined, Sally creates a high-level resource plan. Sally works with Carlos to identify the staff resources she will need for the effort.
Sally requests access to the following staff to prioritize the CDW’s datasets. These CDW staff members support the execution of . She asks executive management to select a set of stakeholders with decision-making authority to create the method used to prioritize datasets. She also denotes the need for access to program and business analysis staff to gather information to rank the priority of the department’s datasets.
Once the dataset priority is established, the effort will need access to a broader set of staff to execute . She summarizes resource needs from the business analysis, program, information security, legal, and technology teams. The high-level plan denotes that specific staff and tooling resource requests will be made once the first dataset is selected for data-sharing improvements.
Sally and Carlos also created the business case to invest in a technology platform to collect and provide web-based access to the resulting data descriptions. The technology platform reduces the project's effort and improves the resulting benefits to internal data consumers.
Sally includes these resource needs in her business case. After the data-sharing initiative is approved, she will work with the supporting teams to develop a schedule that accommodates regular staff duties and commitments.
Now that you have your data-sharing benefits identified, and approach to improve data-sharing and resource plan, you are ready to seek approval to start the dataset prioritization effort.
Create a presentation of your plan to improve data sharing to review with your department’s leadership.
A sample outline of a presentation to management is provided below:
Definition of Data Sharing: Describe data-sharing using terms that are relatable to executive management.
Benefits of Data Sharing: Summarize the findings from your initial research on the benefits of data sharing.
Direct Benefits to the Department: The Guidebook’s supplemental section s provides a detailed description of benefits you can include in your business case.
High-Level Plan: Summarize the iterative approach described in
If you have concerns about delivering the presentation, you can practice with your coach or a co-worker to get feedback and build your confidence with the business case content, and to anticipate questions an audience is likely to raise.
Sally creates a presentation of the plan to improve the CDW’s data-sharing capabilities using the notes captured while creating the CDW data inventory in . She also reviews the CDW BUCP repository created in to identify benefits from past data exchanges.
Sally meets with Ann to review her presentation and get her feedback. Ann provides a specific example of an internal data-sharing effort between the Walk 2 Work and Your Environment programs. Ann also suggests adding how the effort supports key objectives of the 2024 CalHHS IT and Data Strategic Plan, including:
Data-informed insights
Person-centered solution strategies
Continuous improvement through data analysis
Sally incorporates the feedback and schedules a meeting with executive management to present the business case and request resources. Ann will be attending the presentation to CDW leadership to help reinforce the benefits and importance of the data-sharing improvement effort.
Sally reviews her presentation with management and summarizes the following topics:
Benefits of Data-Sharing
Direct Benefits to the Department
High-Level Plan
Required Resources
After reviewing the business case presentation, the CDW executives approve the effort to prioritize the department’s data. Further resources will be approved once a detailed plan is provided to improve the priority dataset that is identified later in . Unfortunately, funding for a data catalog platform is unavailable this fiscal year. Sally will work with Carlos and the CDW IT Team to create a data catalog using existing technology assets.
This Play lays the groundwork for the subsequent Plays by creating an inventory of your department’s datasets. Your data inventory is a core component of data sharing that provides data consumers with a list of datasets. The CalHHS data catalog of open data sets provides an example of this concept. In this Play, you will:
Create a repository for your data inventory.
Create a complete list of datasets.
Review datasets for deprecation, archival, or purging.
Even if you already have a dataset inventory, it is a good practice to periodically audit your inventory to ensure your inventory is complete and accurate.
A bonus from creating your data inventory is that it establishes compliance with SAM (State Administrative Manual) Item 4, requirements for Agencies to maintain an enterprise data inventory.
Creating your data inventory is foundational for later Plays. For example, your data inventory is used in Play 4: Prioritize Your Data, is used to prioritize your datasets.
The Guide provides a distilled set of steps to create your department’s data inventory. Further instruction on creating a data inventory is available from the Centre for Agriculture and Bioscience International (CABI) The data-sharing toolkit’s metadata template is applicable across business domains.
You can capture your data inventory using a data catalog tool or a spreadsheet stored in a collaboration platform (e.g., Microsoft Teams). A spreadsheet stored on a collaboration platform (e.g., Teams) is a quick way to launch your data inventory effort. You can always start creating your data catalog with a spreadsheet and migrate to a cataloging application later.
Once you have your platform established, configure it to capture fields that describe dataset (e.g., Database) key characteristics including:
Title
Program Name
Description
Tags
The Data Sharing Toolkit How to Create a Data Inventory provides additional guidance on characteristics and a sample data inventory format.
Sally and Carlos meet to create the repository to store the California Department of Wellness (CDW) datasets. The CDW doesn’t have a data catalog platform to store the department’s dataset inventory. They decide to start the effort by using the Data Sharing Toolkit How to Create a Data Inventory to create a spreadsheet to store the department’s dataset inventory. They create a new “Teams Site” in Microsoft Teams to store the data inventory spreadsheet and to provide access to the department’s staff once the inventory is complete.
Once the CDW’s data-sharing improvement initiative receives executive approval, they will create a business case to deploy a data cataloging platform to better collect detailed metadata.
It's a challenge to identify all the data that exists in your department. Even if your department has a data catalog, it may not be up to date. Your department likely produces data from different systems and in various formats. Your datasets may also come from different sources including:
Database/Datastores
Report Result Sets
Data Extracts
Application Program Interfaces (API)
The knowledge of your department’s data may be distributed across multiple teams including:
Information technology staff (e.g., Database Administrators) that manage your department's databases.
Analytics staff that create reports and tailored datasets.
Data management staff that create curated data sets.
Program-level staff who created datasets on their own.
These roles may not be represented in your department, but staff who perform these functions can be interviewed to discover your department’s data.
Combining a list of your department’s programs and their corresponding technology platforms creates a comprehensive starting point to inventory your datasets. Although your information technology department likely has a broad view of data sources, they may not have visibility of systems developed by lines of business. Creating the inventory from both the program and technology aspects ensures your dataset list is complete and captures the information needed for your data-sharing efforts. The diagram below depicts the process of collecting your dataset inventory:
Identify and Describe Your Datasets
Later in Play 4: Prioritize Your Data, your team will prioritize datasets based on their relevance to department objectives and cross-program relationships. While creating an inventory, your interactions with other teams allow you to gather information on the department’s datasets to prioritize data-sharing efforts. Execute the steps below to establish your list of datasets and capture their characteristics:
Create a consolidated list by combining your department’s programs with your inventory of supporting IT systems.
Reach out to your IT staff to identify the program owners and points of contact for your systems. Once the points of contact are identified, interview them to gather and enhance the level of detail in your data inventory.
Review available materials (e.g., Description of Programs) to establish context for conducting interviews and discovery sessions effectively.
Conduct discovery sessions or interviews with program teams and data analysts to capture the following:
Populate your data inventory as you capture each dataset’s information to incrementally complete your department’s dataset inventory.
Sally sets out to create a current inventory of the CDW datasets. Sally and Carlos’ effort to inventory the CDW data is depicted in the graphic on the following page:
Creating the CDW Dataset Inventory
After looking through the CDW, she finds an inventory of datasets. The file was last modified ten years ago. To ensure the inventory is current, Sally decides to use the previous inventory as a starting point and update it with the changes that have occurred over the past decade. Her approach is to first get an inventory of datasets known to the CDW Information Technology (IT) team and reconcile this inventory with the list of CDW programs.
Since Carlos recently joined the department, he has not yet learned about all the CDW systems. Carlos asks Andrea, the CDW IT Manager, for a list of the various databases and extracts maintained by CDW. The list from IT has high-level technical information on the datasets and some high-level description of the content but needs additional information from program teams to establish business context.
Sally retrieves a list of the programs (e.g., Healthy Habits) run by the CDW. She added the related programs to the list of systems she received from IT. Sally adds the lists of the CDW programs to verify that the list is complete. She finds that the IT department’s list does not include a system used by the Healthy Habits program. She takes a note to find out more about where the Healthy Habits data is stored.
Before contacting the various programs, Sally prepares discovery session questions to gather the information she needs to complete the data inventory. Sally reads Play 4: Prioritize Your Data to develop questions to gather some initial information that will be later used to prioritize the CDW data-sharing improvement efforts.
The discovery sessions with the departments provide Sally and Carlos with the following:
Business context to enrich the descriptions of the CDW datasets.
The business point of contact for the dataset.
Relationships to other CDW and CalHHS programs.
General information to support the prioritization of data-sharing improvements.
Sally and Carlos also learn some unanticipated information through follow-up questions during the discovery sessions, including:
In the meeting with the Healthy Habits team, Carlos and Sally learned that the program’s IT system is maintained by a vendor. Since the Healthy Habits program directly manages the vendor contract, it is not listed in the inventory from IT. They add the Healthy Habits to the list of datasets to get a complete picture of in-house and vendor- managed data.
The Walk 2 Work program has a forthcoming modernization project. The data-sharing improvement effort includes planning, new system design, and data conversion for the modernization project. During the discovery session, Carlos and Sally learned that the program has created some datasets on their own without assistance from IT. They add these datasets to the inventory.
The Your Environment team was unaware they could request data from other departments using a BUCP data-sharing agreement. This awareness increased interest in supporting Sally and Carlos’ efforts to improve data-sharing. Sally and Carlos scheduled a follow-up with Pankaj to provide an overview of data-sharing.
Sally and Carlos have created the complete inventory of the CDW datasets. The effort also made important new contacts with program and technology staff. Carlos interacted with various programs and staff to build his knowledge of the CDW programs.
After looking at many datasets, they realize this will be a significant effort, and focusing on priority data sets is the best approach.
Your dataset inventory established in this Play is an input to data lifecycle management. The dataset prioritization effort in Play 4: Prioritize Your Data is an opportunity to identify datasets that are candidates for archival or disposal once your department has its data lifecycle processes in place.
It is important to periodically review your list of data for archival and purge. Datasets that are outdated, inaccurate, or no longer in use negatively impact your department by:
Increase risk exposure and potential for data breaches.
Unnecessarily incurring infrastructure costs and using of department technology staff resources.
Inadvertent use of inaccurate or outdated dataset.
Non-compliance with data retention and disposal statutory requirements.
Establishing data archiving and disposal processes and technical capabilities also support BUCP requirements for data disposal after the approvals data use authorization period ends.
The final step of the planning process is also the most important and crucial to successful execution of your project: determining what data you need and where you will find it. This step can be time-consuming and frustrating, but the effort you put in will pay itself back ten-fold when you find yourself sitting down to start data analysis. Accurate, validated, and comprehensive data is the cornerstone to any data-driven initiative. It is critical to prioritize reliability and integrity of the data in order to ensure the legitimacy of your findings. In most data-driven companies, the “80/20 Rule” applies to data projects: 80 percent of your work will be spent finding, retrieving, cleaning, and organizing your data, and only 20 percent spent on actual data analysis. So don’t be surprised if this process seems daunting, and don’t rush through it. In this section, you’ll find information on accessing Internal Data (both within your department and in others) as well as External Data (data owned by some outside agency/organization, and typically publicly available). Use the Process Flow Chart on the following page to choose which resource — the Data Sharing Agreement, the Open Data Portal, your department’s stored data, or publicly available data— is appropriate for each of your data sources.
In most cases, you’ll be working with your Program Data — data that is owned by your department and collected by or for your program. This data resides within your department, and is easily accessible through your department’s Data Coordinator, who is your first resource to seek out when you need help thinking of what data to source for your project or where to find it. Please email [email protected] for help with contacting your department’s data coordinator.
In a few cases, you may find that your department does not have enough data for you to proceed with data analysis. To ensure you have a sufficient amount of data to begin your analysis, you are encouraged to look to other departments’ data assets and determine if they’d be appropriate for your project. Your first step to finding data in other departments is to check the CHHS Open Data Portal, our database for all CHHS data that is publicly-available.
Data Sharing Agreement: Accessing private data in other departments is dictated by the CHHS Data Sharing Agreement, a legal document that entitles the departments under CHHS to access the other CHHS department’s data assets through a Business Use Case Proposal. Only proceed with this section if you’ve (1) decided that some of the data you need is not already available through your department and (2) is NOT found on the Open Data Portal, then this is your next step.
The goals of the Data Sharing Agreement are the following:
Establish a legal framework for data initiatives Maximize appropriate sharing to increase positive outcomes and customer service Ensure privacy and security protections Reduce risk and use of duplicative resources Standardize data use agreements among CHHS Departments and offices Reduce contracting and data use agreement redundancies Track activity for better understanding of common data sharing needs between CHHS departments To get data via the Data Sharing Agreement, you must contact your department’s Data Coordinator and submit a Business Use Case Proposal; this ensures proper documentation of what data you need, why you need it, and your commitment to several requirements, such as preserving the shared dataset in the form it was given to you. For more detailed instructions, visit the Business Use Case instructions or view the FAQ.
In the past decade, public interest in big data and data-driven projects has skyrocketed. As a result, there is a wealth of data available for free that may help you contextualize your results, find baseline measurements, or contribute to your findings. This section showcases some of our favorite sources of publicly available data.
USAFacts.org — A data-driven portrait of the American population, our government’s finances, and government’s impact on society that uses federal, state, and local data from over 70 sources.
datacatalogs.org — DataCatalogs.org aims to be the most comprehensive list of open data catalogs in the world. It is curated by a group of leading open data experts from around the world - including representatives from local, regional and national governments, international organizations such as the World Bank, and numerous NGOs.
HealthData.gov — Dedicated to making high value health data more accessible to entrepreneurs, researchers, and policy makers in the hopes of better health outcomes for all.
The topics addressed in the CalHHS Data-Sharing Guidebook were identified by conducting discovery sessions with a sample of the agency’s departments. The lessons learned focus on data sharing via a Business Use Case Proposal (BUCP) but apply to other sharing agreements as well. The lessons learned provided by discovery session participants are provided in this section and address the following categories:
The table below summarizes the lessons learned provided by discovery session participants and the benefits they provide to data sharing. Where applicable, the lessons learned reference the Data-Sharing Plays provided later in the Guidebook.
We hope you have learned a few new ideas and want to take your data-sharing journey beyond this Guidebook. This section provides references to data architecture resources to guide you as you continue your learning path. Some of these references were used in the creation of this Guidebook.
If you are ever stuck, contact your Department’s data coordinator for information on how to find and exchange CHHS data.
CalHHS Information Strategic Plan
Is this a portion of the address or the complete address?
Duration
Duration in Minutes
The duration in minutes.
It’s not clear to the data consumer what the duration refers to. Is this the time used for the walk to work? Is this the duration of a stop during the walk to work?
This field captures the duration the W2W participant remained at a Location (e.g., Stopped) during their commute.
This field captures the duration in whole minutes the W2W participant remained at a Location (e.g., Stopped) during their commute.
When possible, avoid including proper names in the BUCP and refer instead to roles to mitigate amendments/updates due to staff changes.
Reduces BUCP management efforts and mitigates timeline impacts from administrative changes.
Avoid using department-specific jargon where possible. If specialized terms are required, make sure to define them.
This approach promotes clarity in BUCP requests and creates a common set of terms for communication/coordination.
Gather the required staff via in- person meetings or web conferences to address key aspects of the agreement. Do not rely solely on email communication.
Working sessions reduce the time required to resolve critical aspects of data-sharing. Working sessions also establish relationships to help resolve data-sharing challenges that may arise during approval or fulfillment.
Allocate sufficient time for the creation and approval of the data-sharing agreement. Include times for unknowns that will arise.
Allocating sufficient time allows the downstream users of your shared data (e.g., Program Staff) to schedule their initiatives.
The subsequent section, Data-Sharing Plays, Play 1: Establish Data- Sharing Metrics and BUCP Tracking, provides ideas for creating capabilities
to track BUCP approval metrics for planning purposes.
Encourage your department’s leadership to include data sharing in planning.
Creating a shared understanding of data-sharing importance benefits your efforts, including:
Staff resource and funding allocation
General support during the BUCP process
The subsequent section, Data-Sharing Plays, Play 3: Create a Business Case, provides ideas to secure executive support for data-sharing.
Metrics tracked in the BUCP repository created in Data-Sharing Plays, Play
1: Establish Data-Sharing Metrics and BUCP Tracking, provide metrics and outcomes to gain leadership support.
Engage your department’s BUCP experts early in BUCP planning. Expertise may reside within other programs/units within your department.
Expands the pool of BUCP expertise available to your department.
Promotes schedule stability and reduces rework during BUCP creation.
Designate a use case sponsor for clarification and decision- making.
An empowered sponsor provides a focal point for scope clarification and decision-making.
Designate a specific coordinator or product owner for each BUCP to help coordinate internal and external stakeholders. Designate a BUCP core team composed of the required skills (data, technical, legal).
Clear roles and a consistently engaged core team reduce BUCP approval time.
Cleary explain why the data is needed in your BUCP and include links to relevant legislation.
A clear output/use and legislative justification improves the strength of your business case and support from the data provider.
Ask the data provider if assistance will help reduce the time needed for data fulfillment.
Reduces the time to receive data and establishes close working relationships between the data requestor and provider staff.
Research both State and Federal statutes that govern data sharing before requesting data.
Understanding restrictions before requesting data helps you efficiently use your department and the data provider’s time. Identify and address any restrictions in your BUCP. For example, some Federal statutes require traceable benefits from data sharing to program participants.
The CalHHS Open Data Portal’s Dataset Catalog is a source for identifying datasets and their related department.
Improves the ability to locate required datasets and identify the maintaining department/program.
Check the CalHHS Open Data Portal to determine if an existing open dataset addresses your requirements.
Using open data eliminates the need for a BUCP. Please see the following web pages for further information for guidance on when data-sharing agreements are required:
Evaluating the viability of open datasets before launching a BUCP effort bolsters your justification for the investment in creating a data-sharing agreement and request for identified data.
Include a specific business need to justify why the identified data is needed.
Specific business needs play a vital role in the following:
Security Approval
Addressing Statutory Requirements
Dispute Resolution
Limit the scope of your data requests to the required data elements.
Limiting requests to specific required data improves BUCP approval and fulfillment timelines by reducing the scope of security and legal reviews. Accurately scoping data elements also reduces the effort to produce shared datasets.
The subsequent section, Data-Sharing Plays, Play 6: Describe Your Data, describes the process to create a detailed data element inventory and security classifications to scope data requests.
Identify all statutory and legal requirements early in the BUCP process.
Early identification of statutory requirements allows for proactive legal resolution or time to identify alternative solutions (e.g., Aggregated Data).
The subsequent section, Data-Sharing Plays, Play 6: Describe Your Data, includes guidance to include citations to legal statutes in data descriptions for awareness early in the BUCP process.
Be sure to analyze requested data to identify any linked data from third parties (additional departments/organizations) for additional statutory requirements.
Mitigates the potential for late detection of statutory requirements in the BUCP that may flow from the third-party entity.
Research and identify statutes and legislation that authorize the data provider to share your data with the requesting department/program.
Identifying the statutes that allow data- sharing increases the probability the BUCP will be approved. Citations are also helpful in resolving data-sharing concerns.
If a statutory consideration impacts data sharing, ask the data provider for their concerns and references to the impacting statute(s).
Specific information allows data requestor and provider teams to work together more effectively.
Your legal team’s interpretation may also help your business, data, and technical teams identify alternate solutions. For example, when the data provider cannot share data on individual program participants, an alternative solution may be for the data-provider to combine the target datasets and provide aggregated data.
Engage your department’s information security team early in the data-sharing planning.
Early engagement mitigates potential schedule impacts from security reviews.
Develop a thorough understanding of the security approval process.
A complete understanding of your information security team’s requirements lets your team assemble required information in a planned manner.
Identify a data transfer method that addresses security requirements and with data provider/recipient technical capabilities early in the BUCP creation process.
Early identification of a data transfer method mitigates delays in data fulfillment by allowing time for potential technology changes. Early identification of a data transfer method mitigates adjustments to security approvals.
The subsequent section, Data-Sharing Plays, Play 8: Prepare to Receive Data, provides a guide to identify data transfer mechanisms proactively.
If the data provider and recipient don’t have viable data transfer options, investigate the use of California Department of Technology (CDT) services.
CDT services provide an option that reduces the time and cost to establish data transfer capabilities.
In the subsequent section, Data- Sharing Plays, Play 8: Prepare to Receive Data provides examples and links to the CDT SAFE file transfer service.
Provide data recipients with data descriptions to promote data understanding.
Descriptions allow data recipients to work more efficiently with shared data and improve the accuracy of data analysis.
Descriptions benefit data providers by reducing time spent answering data- related questions.
The subsequent section, Data-Sharing Plays, Play 6: Describe Your Data, provides a guide to creating data descriptions for use by data recipients and other teams (e.g., Analytics Development) within your department.
Create curated datasets for commonly requested data.
Curated datasets address specific business subjects/topics and are well- described. Creating curated datasets promotes data requestors' understanding and reduces the time to produce shared data.
BUCP processes, tools, and standard content may have been developed organically at the program level and easily accessible. Create a centralized BUCP repository.
A centralized BUCP repository distributes the data-sharing assets developed by individual programs across your department. The repository also provides a library of previous BUCPs for reference and potential content reuse. In the subsequent section, Data- Sharing Plays, Play 1: Establish Data-Sharing Metrics and BUCP Tracking, describes creating a centralized BUCP repository.
Collect internal lessons learned at the program level for inclusion in your department-level BUCP repository.
A centralized repository provides department-wide benefits from lessons learned by individual programs and data teams. You can use this Guide as the starting point for your department’s collection of lessons learned.
Track BUCP processing metrics such as approval times. Track the business outcomes from sharing data.
Collecting metrics and outcomes helps justify departmental investment in staff and data-sharing improvements.
In the subsequent section, Data- Sharing Plays, Play 1: Establish Data-Sharing Metrics and BUCP Tracking, provides ideas to create a platform to track BUCP-related metrics and data-sharing outcomes.
Create procedures and training materials that reflect your department’s BUCP processes.
Departmental procedures and training build awareness of data sharing across your department to reduce the learning curve and establish consistency.
The Your Environment team is starting an effort to create a de-identified (masked dataset) to expand the pool of staff available for testing. The metadata and security classifications will help build the business rules for this effort.
Deliverable: Describe the data inventory and prioritization. Regardless of whether the initiative moves forward, the department will better understand its data.
Request for Staff Support: List the staff resources for the effort to prioritize the department datasets.
Approval to Develop a Prioritization Rubric: Obtain approval and access to department data stakeholders to create a standard mechanism to prioritize data-sharing improvements.

Security Classification(s)
Data Update Frequency
Related IT Systems
Database Platforms
Program(s)
Program Point(s) of Contact
Relationship to Other Programs
A business-level description of the dataset.
Relevant points of contact.
Cross-program relationships.
Relationship to department and agency objectives.
Census Reporter — A Knight News Challenge-funded project to make it easier for journalists to write stories using information from the U.S. Census bureau. Place profiles and comparison pages provide a friendly interface for navigating data, including visualizations for a more useful first look.
CalEnviro Screen — A mapping tool that helps identify California communities that are most affected by many sources of pollution, and where people are often especially vulnerable to pollution’s effects. California Healthy Places Index — A tool to explore community conditions that predict life expectancy. It contains user-friendly mapping and data resources at the census tract level across California.
CHHS Open Data Portal — Offers access to standardized data that can be easily retrieved, combined, downloaded, sorted, searched, analyzed, redistributed and re-used by individuals, business, researchers, journalists, developers, and government to process, trend, and innovate.


CalHHS Master Data Management Strategy
Data sharing materials:
CalHHS Data Sharing - Process Flow
CalHHS Data Sharing - Legal Agreement
CalHHS Data Sharing - Frequently Asked Questions (FAQs)
Business Use Case Proposal - Form
Business Use Case Proposal - Instructions
The list below provides links to reference materials on data architecture and data-sharing practices:
The Data Management Associate (DAMA) focuses on data and information management and the advancement of the field.
The Findability, Accessibility, Interoperability, and Reusability (FAIR) Guiding Principles were authored to provide data management guidelines and best practices.
The Centre for Agriculture and Bioscience International (CABI) data-sharing toolkit provides online training for data-sharing practices.
Oracle’s Cloud Infrastructure Documentation’s explanation of Data Architecture roles, goals, and practices.
Public data resources are available from a number of online sources, including the federal government and non-profit organizations. Following is a partial list of select data resources that can help contribute to data projects and analyses.
USAFacts.org – A data-driven portrait of the American population, our government’s finances, and government’s impact on society that uses federal, state, and local data from over 70 sources.
Healthdata.gov – Dedicated to making high value health data more accessible to entrepreneurs, researchers, and policy makers in the hopes of better health outcomes for all.
CIA World Fact Book - Provides information on the history, people, government, economy, geography, communications, transportation, military, and transnational issues for 267 world entities.
– Makes it easier to get access to publicly available FDA data. FDA’s goal is to make it simple for an application, mobile device, web developer, or researcher to use data from the FDA.
– A Knight News Challenge-funded project to make it easier for journalists to write stories using information from the U.S. Census bureau. Place profiles and comparison pages provide a friendly interface for navigating data, including visualizations for a more useful first look.
- A mapping tool that helps identify California communities that are most affected by many sources of pollution, and where people are often especially vulnerable to pollution’s effects.
- A tool to explore community conditions that predict life expectancy. It contains user-friendly mapping and data resources at the census tract level across California.
- Offers access to standardized data that can be easily retrieved, combined, downloaded, sorted, searched, analyzed, redistributed and re-used by individuals, business, researchers, journalists, developers, and government to process, trend, and innovate.
lucidchart.com will help you create a use case diagram
Visual Paradigm will also help you create a use case diagram
For managers, Key Performance Indicators (KPIs) are also a great framework for measuring performance relative to your goals.
Check out to learn what they are, why they work, and how to set effective KPIs
Data readiness: Harvard’s offers a useful template.
gives more specific data readiness guidance.
- This document is dense, but gives great insight into what you need to carry out a successful product.
Here are some key concepts and help integrating them into Excel
This section provides links to online training materials for further study of data architecture practices.
A State Library Card is a unique tool for state employees to access research and training materials. After applying for a State Library Card, you can access technical resources such as materials from O’Reilly for Higher Education.
Premier Advantage California eLearning PACe is the Office of Professional Development’s eLearning offering for IT and business professionals.
The Association for Computing Machinery (ACM) is a gateway to eLearning, books/videos, research, and the overall computing community. You can access the materials you need to develop your data management knowledge and forge connections with other professionals to advance the field.
If you just need a quick chart or table, check out these online tools — they are simpler to use than the advanced data visualization guides and may be more appropriate for your specific project:
Google Charts (interactive charts & simple data tools)
DataWrapper (charts, tables, and maps)
Infogram (beginner-friendly, collaborative, focuses on design thinking principles)
More sophisticated guides are listed below:
Beginner
A suite of easy-to-use web tools for beginners that introduce concepts of working with data. These simple tools make it easy to work with data in fun ways, so you can learn how to find great stories to tell.
Beginner
This article summarizing general Data Visualization strategies and common methods used in different professions and sectors.
Beginner
Tableau’s Data Visualization for Beginners: a Definition & Learning Guide with helpful examples
Beginner-Intermediate
Kaggle’s Data Visualization Course teaches you how to implement some more basic, powerful data visualization techniques (line charts, scatter plots, and distributions) and how to choose the right one.
Use the Color Contrast Grid tool to test many foreground and background color combos for compliance with WCAG 2.0 minimum contrast.
Use a word editing app like Hemingway to improve the readability of your writing. Hemingway will highlight lengthy or run-on sentences, remove overly dense writing, offer alternatives for weak adverbs and phrases as well as poor formatting choices.
Visualize your story with a storyboard (see MIT’s guide to finding a story in your data)
The overarching legal framework for the CHHS Data De-identification Guidelines is the California Information Practices Act, California Civil Code 1798 et seq., which was established in 1977 and applies to all state government entities. The IPA includes requirements for the collection, maintenance, and dissemination of any information that identifies or describes an individual. The IPA and other California statutes limit the disclosure of personal information, consistent with the California Constitutional right to privacy. However, state agencies are generally permitted (and sometimes required under the California Public Records Act and other laws) to disclose data that have been de-identified. Summarized or aggregated data may still be identifiable; the DDG provides Guidelines for assessing whether data have been de-identified.
While most state agencies are covered by the IPA, some are also covered by or impacted by HIPAA. Unlike the IPA, which applies to all personal information, HIPAA only applies to certain health or healthcare-related information. HIPAA requirements apply in combination with IPA requirements.
“Personal Information” is defined by the California Civil Code section 1798.3(a) as “any information that is maintained by an agency that identifies or describes an individual, including, but not limited to,
his or her name,
social security number,
physical description,
home address,
Under Section 1798.24 of the IPA, “An agency shall not disclose any personal information in a manner that would link the information disclosed to the individual to whom it pertains,” unless it is disclosed as described in Section 1798.24.
Senate Bill 13 updated the IPA, effective January 1, 2006, to require Committee for the Protection of Human Subjects (CPHS) review and approval before personal information (linkable to any individual) that is held by any state agency or department can be released for research purposes. CPHS does not delegate reviews for compliance with the IPA to other institutional review boards. ()
California Laws Governing the Collection and Release of Confidential, Personal, or Sensitive Information (please note that this is not an exhaustive list)
Civil Code 1798.24, 1798.24a, 1798.24b (all personal information including health data)
Government Code 11015.5 (electronically collected personal information) General Medical Data
Civil Code 56.10 – 56.11
Civil Code 56.13
Health & Safety Code 105206 Developmentally Disabled
Health & Safety Code 416.18
Health & Safety Code 416.8
Welfare & Institutions Code 4514, 4514.3, 4514.5
Health & Safety Code 59016 General Public Health Records
Health & Safety Code 121035
Health & Safety Code 100330 Genetic Information
Health & Safety Code 124975
Welfare & Institutions Code 5328 through 5328.9
Welfare & Institutions Code 5329 (aggregation and publication of data)
Welfare & Institutions Code 5540
Welfare & Institutions Code 5610
Welfare & Institutions Code 14100.2
Welfare & Institutions Code 14015.8
Welfare & Institutions Code 14101.5 Parkinson’s Disease Registry
Health & Safety Code 103865 Payment and Billing Info
Welfare & Institutions Code 10850 (Confidential Information) Public Social Services
Welfare & Institutions Code 10850 Substance Abuse Treatment Data
Health & Safety Code 11845.5
Health & Safety Code 11812 Vital Records
Please note that this is not an exhaustive list
HIPAA - Section 164.514 of the HIPAA Privacy Rule (45 CFR)
42 CFR Part 2
Family Educational Rights and Privacy Act (FERPA) (20 U.S.C. § 1232g; 34 CFR Part 99)
Freedom of Information Act (FOIA) (5 U.S.C. § 552)
While the IPA does not include specific de-identification methods or criteria, the basic concept of statistical de-identification has no different meaning, and the basic standard of protection of identifiable data is no different for IPA covered PI than for HIPAA covered PHI.
The California Office of Health Information Integrity (CalOHII) is authorized by state statute to coordinate and monitor HIPAA compliance by all California State entities within the executive branch of government covered or impacted by HIPAA. The 2014 assessment that was revised July 2015, identified programs and departments in CalHHS that are considered covered entities under HIPAA as a Health Care Provider, Health Care Plan, Health Care Clearinghouse, Hybrid Entity or Business Associate. Detail is provided in Appendix B. One difference between CA IPA and HIPAA is the documentation requirement in HIPAA for data de-identified using the Expert Determination method. Each of the following departments will need to identify which programs within the department are impacted by HIPAA as part of the department specific DDG.
Department of Aging
Department of Developmental Services
Department of Health Care Services
Department of Managed Health Care
For programs and departments that are covered by HIPAA, de-identification must meet the HIPAA standard. The DDG serves as a tool to make and document an expert determination consistent with the HIPAA standard. The following comes from federal guidance for HIPAA that provides more detail regarding Safe Harbor and Expert Determination under the HIPAA standard.
The HIPAA Standard for de-identification of protected health information (PHI) states “Health information that does not identify an individual and with respect to which there is no reasonable basis to believe that the information can be used to identify an individual is not individually identifiable health information.” If the data are de-identified, and it is not reasonably likely that the data could be re-identified, the Privacy Rule no longer restricts the use or disclosure of the de-identified data.
The following is quoted from the “Guidance Regarding Methods for De-identification of Protected Health Information in Accordance with the Health Insurance Portability and Accountability Act (HIPAA) Privacy Rule”, published November, 2012 by the U.S. Department of Health & Human Services, Office for Civil Rights: ()
Formatting of text may be different than the original document.
Section 164.514(a) of the HIPAA Privacy Rule provides the standard for de-identification of protected health information. Under this standard, health information is not individually identifiable if it does not identify an individual and if the covered entity has no reasonable basis to believe it can be used to identify an individual.
§ 164.514 Other requirements relating to uses and disclosures of protected health information. (a) Standard: de-identification of protected health information. Health information that does not identify an individual and with respect to which there is no reasonable basis to believe that the information can be used to identify an individual is not individually identifiable health information.
Sections 164.514(b) and(c) of the Privacy Rule contain the implementation specifications that a covered entity must follow to meet the de-identification standard. As summarized in Figure 1, the Privacy Rule provides two methods by which health information can be designated as de-identified.
The first is the “Expert Determination” method:
(b) Implementation specifications: requirements for de-identification of protected health information. A covered entity may determine that health information is not individually identifiable health information only if: (1) A person with appropriate knowledge of and experience with generally accepted statistical and scientific principles and methods for rendering information not individually identifiable: (i) Applying such principles and methods, determines that the risk is very small that the information could be used, alone or in combination with other reasonably available information, by an anticipated recipient to identify an individual who is a subject of the information; and (ii) Documents the methods and results of the analysis that justify such determination; or
The second is the “Safe Harbor” method:
(2)(i) The following identifiers of the individual or of relatives, employers, or household members of the individual, are removed:
(A) Names
(B) All geographic subdivisions smaller than a state, including street address, city, county, precinct, ZIP code, and their equivalent geocodes, except for the initial three digits of the ZIP code if, according to the current publicly available data from the Bureau of the Census: (1) The geographic unit formed by combining all ZIP codes with the same three initial digits contains more than 20,000 people; and (2) The initial three digits of a ZIP code for all such geographic units containing 20,000 or fewer people is changed to 000
Intermediate
A visualization grammar, a declarative language for creating, saving, and sharing interactive visualization designs. With Vega, you can describe the visual appearance and interactive behavior of a visualization in a JSON format and generate web-based views using Canvas or SVG.
Intermediate-Advanced
The Data Visualization Catalogue has a comprehensive list of charts that are separated by what data visualization function they employ.
Advanced
Data-Driven Documents D3 is a JavaScript library for manipulating documents based on data. D3 helps you bring data to life using HTML, SVG, and CSS. D3’s emphasis on web standards gives you the full capabilities of modern browsers without tying yourself to a proprietary framework, combining powerful visualization components and a data-driven approach to DOM manipulation.
All Levels
Coursera often has free online Data Visualization Courses — check to see if one is available!
education,
financial matters, and
medical or employment history.
It includes statements made by, or attributed to, the individual.”
Civil Code 56.29
Health & Safety Code 128730
Health & Safety Code 128735
Health & Safety Code 128736
Health & Safety Code 128737
Health & Safety Code 128745
Health & Safety Code 128766 Birth Defects
Health & Safety Code 103850 Blood Lead Analysis
Health & Safety Code 124130 Cancer
Health & Safety Code 104315
Health & Safety Code 103875
Health & Safety Code 103885 Child Health Information
Health & Safety Code 130140.1 Child Health Screening
Health & Safety Code 124110
Health & Safety Code 124991
Welfare & Institutions Code 4744
Welfare & Institutions Code 4659.22
Health & Safety Code 125105 (prenatal test)
Civ. Code 56.17 HIV/AIDS
Health & Safety Code 121022
Health & Safety Code 121023
Health & Safety Code 121025
Health & Safety Code 121075
Health & Safety Code 121085
Health & Safety Code 121110
Health & Safety Code 121125
Health & Safety Code 121010
Health & Safety Code 120820
Health & Safety Code 120980
Health & Safety Code 121280
Health & Safety Code 120962
Health & Safety Code 120975
Health & Safety Code 121080
Health & Safety Code 121090
Health & Safety Code 121095
Health & Safety Code 121120
Rev. & T. Code 19548.2 Immunizations
Health & Safety Code 120440 Independent Medical Review
Health & Safety Code 1374.33
Welfare & Institutions Code 4135
Education Code 56863
Health & Safety Code 440.40 (applies only to GACHs) Prenatal Tests
Health & Safety Code 120705
Health & Safety Code 125105
Health & Safety Code 102430
Health & Safety Code 102425
Health & Safety Code 102426
Health & Safety Code 102455
Health & Safety Code 102460
Health & Safety Code 102465
Health & Safety Code 102475
Health & Safety Code 103025
Department of Social Services
Department of State Hospitals
Health and Human Services Agency
Office of Systems Integration
(D) Telephone numbers
(L) Vehicle identifiers and serial numbers, including license plate numbers
(E) Fax numbers
(M) Device identifiers and serial numbers
(F) Email addresses
(N) Web Universal Resource Locators (URLs)
(G) Social security numbers
(O) Internet Protocol (IP) addresses
(H) Medical record numbers
(P) Biometric identifiers, including finger and voice prints
(I) Health plan beneficiary numbers
(Q) Full-face photographs and any comparable images
(J) Account numbers
(R) Any other unique identifying number, characteristic, or code, except as permitted by paragraph (c) of this section [Paragraph (c) is presented below in the section “Re-identification”]; and
(K) Certificate/license numbers
(ii) The covered entity does not have actual knowledge that the information could be used alone or in combination with other information to identify an individual who is a subject of the information.
Satisfying either method would demonstrate that a covered entity has met the standard in §164.514(a) above. De-identified health information created following these methods is no longer protected by the Privacy Rule because it does not fall within the definition of PHI. Of course, de-identification leads to information loss which may limit the usefulness of the resulting health information in certain circumstances. As described in the forthcoming sections, covered entities may wish to select de-identification strategies that minimize such loss.
Re-identification
The implementation specifications further provide direction with respect to re-identification, specifically the assignment of a unique code to the set of de-identified health information to permit re-identification by the covered entity.
If a covered entity or business associate successfully undertook an effort to identify the subject of de-identified information it maintained, the health information now related to a specific individual would again be protected by the Privacy Rule, as it would meet the definition of PHI. Disclosure of a code or other means of record identification designed to enable coded or otherwise de-identified information to be re-identified is also considered a disclosure of PHI.
(c) Implementation specifications: re-identification. A covered entity may assign a code or other means of record identification to allow information de-identified under this section to be re-identified by the covered entity, provided that: (1) Derivation. The code or other means of record identification is not derived from or related to information about the individual and is not otherwise capable of being translated so as to identify the individual; and (2) Security. The covered entity does not use or disclose the code or other means of record identification for any other purpose, and does not disclose the mechanism for re-identification.

Formed or calculated by the combination of many separate units or items (Oxford Dictionary).
An application programming interface, which is a set of definitions of the ways one piece of computer software communicates with another. It is a method of achieving abstraction, usually (but not necessarily) between higher-level and lower-level software.
The California Public Records Act (Statutes of 1968, Chapter 1473; currently codified as California Government Code §§ 6250 through 6276.48) was a law passed by the California State Legislature and signed by the Governor in 1968. The law defines what state and local government records are open to public inspection.
A catalog is a collection of data tables or web services.
A comma separated values (CSV) file is a computer data file used for implementing the organizational tool, the Comma Separated List. The CSV file is used for the digital storage of data structured in a table of lists form. Each line in the CSV file corresponds to a row in the table. Within a line, fields are separated by commas, and each field belongs to one table column. CSV files are often used for moving tabular data between two different computer programs (like moving between a database program and a spreadsheet program).
A set of values (data points) representing a specific concept or concepts. Data include, but are not limited to, 1) geospatial data 2) unstructured data, and 3) structured data.
A collection of data stored according to a schema such that a computer can easily find the desired information.
An organized collection of related data records maintained on a storage device, with the collection containing data organized or formatted in a specific or prescribed way, often in tabular form. In this handbook the dataset refers to the master, primary, or original authoritative collection of the data (herein synonymous with database).
The data steward is the person who has the greatest familiarity with and knowledge of the data table, the data it contains, and the purpose for the collection of the data. The data steward should know the accuracy and currency of the data, and be best able to supply metadata elements describing the data.
A data table, in this handbook, refers to a subset of the dataset which may include a selection and/or aggregation of data from the original dataset.
Generally defined under the HIPAA Privacy Rule (45 CFR section 164.514) as information (1) that does not identify the individual and (2) for which there is no reasonable basis to believe the individual can be identified from it.
The portion of the overall population being referenced in a table or a figure representing the total population in terms of which statistical values are expressed (Oxford Dictionary).
A geographic information system (GIS) is a computer system designed to capture, store, manipulate, analyze, manage, and present all types of geographical data allowing the user to question, analyze, and interpret data to understand relationships, patterns, and trends.
Information means any communication or representation of knowledge such as facts, data, or opinions in any medium or form, including textual, numerical, graphic, cartographic, narrative, or audiovisual forms.
JSON (JavaScript Object Notation) is a lightweight data-interchange format. It is easy for both humans to read and write and machines to parse and generate. It is based on a subset of the JavaScript Programming Language, Standard ECMA-262 3rd Edition - December 1999. JSON is a text format that is completely language independent but uses conventions that are familiar to programmers of the C-family of languages, including C, C++, C#, Java, JavaScript, Perl, Python, and many others. These properties make JSON an ideal data-interchange language.
Refers to information or data that is in a format that can be easily processed by a computer without human intervention while ensuring no semantic meaning is lost.
To facilitate common understanding, a number of characteristics, or attributes, of data are defined. These characteristics of data are known as "metadata," that is, "data that describes data." For any particular datum, the metadata may describe how the datum is represented, ranges of acceptable values, its relationship to other data, and how it should be labeled. Metadata also may provide other relevant information, such as the responsible steward, associated laws and regulations, and access management policy. Each of the types of data described above has a corresponding set of metadata. Two of the many metadata standards are the Dublin Core Metadata Initiative (DCMI) and Department of Defense Discovery Metadata Standard (DDMS). The metadata for structured data objects describes the structure, data elements, interrelationships, and other characteristics of information, including its creation, disposition, access and handling controls, formats, content, and context, as well as related audit trails. Metadata includes data element names (such as Organization Name, Address, etc.), their definition, and their format (numeric, date, text, etc.). In contrast, data is the actual data values such as the "US Patent and Trade Office" or the "Social Security Administration" for the metadata called "Organization Name." Metadata may include metrics about an organization's data including its data quality (accuracy, completeness, etc.).
The number of specific cases as identified by the variable from a given population or the number above the line in a common fraction showing how many of the parts indicated by the denominator are taken (Oxford Dictionary).
Includes information that is maintained by an agency which identifies or describes an individual, including his or her name, social security number, physical description, home address, home telephone number, education, financial matters, email address and medical or employment history. It includes statements made by, or attributed to, the individual (California Civil Code section 1798.3).
information which relates to the individual’s past, present, or future physical or mental health or condition, the provision of health care to the individual, or the past, present, or future payment for the provision of health care to the individual, and that identifies the individual, or for which there is a reasonable basis to believe can be used to identify the individual (HIPAA, 45 CFR section 160.103).
The process by which the public requests state or local government records.
A data table that meets one of the following criteria: (1) data that are public by law such as via the Public Records Act or (2) the data are not prohibited from being released by any laws, regulations, policies, rules, rights, court order, or any other restriction. Data shall not be released if it is highly restricted due to HIPAA, state, or federal law.
Resource Description Framework - a family of specifications for a metadata model. The RDF family of specifications is maintained by the World Wide Web Consortium (W3C). The RDF metadata model is based upon the idea of making statements about resources in the form of a subject-predicate-object expression…and is a major component in what is proposed by the W3C's Semantic Web activity: an evolutionary stage of the World Wide Web in which automated software can store, exchange, and utilize metadata about the vast resources of the Web, in turn enabling users to deal with those resources with greater efficiency and certainty. RDF's simple data model and ability to model disparate, abstract concepts has also led to its increasing use in knowledge management applications unrelated to Semantic Web activity.
Matching de-identified, or anonymized, personal information back to the individual.
A family of web feed formats (often dubbed Really Simple Syndication) used to publish frequently updated works — such as blog entries, news headlines, audio, and video — in a standardized format. An RSS document (which is called a "feed," "web feed," or "channel") includes full or summarized text, plus metadata such as publishing dates and authorship.
An XML schema defines the structure of an XML document such as which data elements and attributes can appear in a document; how the data elements relate to one another; whether an element is empty or can include text; which types of data are allowed for specific data elements and attributes; and what the default and fixed values are for elements and attributes. A schema is also a description of the data represented within a database. The format of the description varies but includes a table layout for a relational database or an entity-relationship diagram. It is method for specifying constraints on XML documents.
A shapefile is a digital vector (non-topological) storage format for storing geometric location and associated attribute information and is widely used in GIS software. It stores map (geographic) features and attribute data as a collection of files having the same prefix and the following file extensions:
.shp - the file that stores the feature geometry. Required.
.shx - the file that stores the index of the feature geometry. Required.
.dbf - the dBASE file that stores the attribute information of features. Required.
.sbn and .sbx - the files that store the spatial index of the features. Optional.
.fbn and .fbx - the files that store the spatial index of the features for shapefiles that are read-only. Optional.
.ain and .aih - the files that store the attribute index of the active fields in a table or a theme's attribute table. Optional.
.prj - the file that stores the coordinate system information. Optional.
.xml - metadata for using shapefiles on the Internet. Optional.
Since a shapefile is non-topological it does not maintain spatial relationship information such as connectivity, adjacency, and area definition. This makes the format simpler but less capable when performing complex spatial analysis.
In the context of aggregated data, an aggregate number that carries a risk of re-identification due to the collection of personally identifiable information in small geographic and/or temporal units, resulting in very low counts in health or demographic data. For example, an aggregate count of 2 preterm births among Asian mothers in a small population has effectively revealed those individuals if they are the only two Asian women in the population. For a detailed discussion of small cell size and methods to address it, see the CHHS Data De-Identification Guidelines.
Data that is more free-form, such as multimedia files, images, sound files, or unstructured text. Unstructured data does not necessarily follow any format or hierarchical sequence, nor does it follow any relational rules. Unstructured data refers to masses of (usually) computerized information which do not have a data structure which is easily readable by a machine. Examples of unstructured data may include audio, video and unstructured text such as the body of an email or word processor document. Data mining techniques are used to find patterns in, or otherwise interpret, this information.
Extensible Markup Language (XML) is a flexible language for creating common information formats and sharing both the format and content of data over the Internet and elsewhere.
Below are common acronyms across the CalHHS Data Sharing documentation. This list of acronyms is intended to be stand alone and acronyms here are duplicated from the glossary.
API
Application Programming Interface
.ain (or .aih)
GIS file that stores the attribute index of the active fields in a table
CalOHII
California Office of Health Information Integrity
CDC
Centers for Disease Control and Prevention
CDII
Center for Data Insights and Innovation
CDPH
California Department of Public Health
In this Play, your data team utilizes the metadata repository created in Play 5: Establish Your Metadata Repository and the dataset prioritization established in Play 4: Prioritize Your Data to improve the usability of your data. By executing this Play, dataset individual fields/attributes are elaborated with the following types of information:
Business descriptions
Preparing your data for sharing with other departments requires staff time and resources; this step focuses and prioritizes data-sharing efforts on data that yields the most benefits to your department and data consumers from other organizations. Starting with a single priority dataset delivers benefits more quickly than an expansive effort across all your department’s data and better utilizes staff resources. Additionally, an incremental approach allows your team to “inspect and adapt” with each iteration to improve efficiency.
Your dataset inventory created in is the foundation to prioritize data-sharing improvement efforts.
This Play provides general guidance to:
CDSS
Department of Social Services
CalHHS
California Health and Human Services Agency
CMS
Centers for Medicare and Medicaid Services
CPHS
Committee for the Protection of Human Subjects
CSV
Comma Separate Values
.dbf
GIS dBASE file that stores attribute information of the features
DDG
Data De-Identification Guidelines
DHCS
Department of Health Care Services
.fbn (or .fbx)
GIS file that stores spatial index of the features (read-only)
GIS
Geographic Information System
HCAI
Department of Health Care Access and Information
HIPAA
Health Insurance Portability and Accountability Act
IPA
Information Practices Act
JSON
JavaScript Object Notation
MHSOAC
Mental Health Services Oversight and Accountability Commission
PHI
Protected Health Information
PI
Personal Information
PII
Personally Identifiable Information
PRA
Public Records Act
.prj
GIS file that stores the coordinate system information
PRT
Peer Review Team
RDF
Resource Description Framework
RSS
Really Simple Syndication (Feed)
.sbn (or .sbx)
GIS file that stores spatial index of the features.
.shp
GIS shapefile that stores the feature geometry
.shx
GIS shapefile that stores the index of the feature geometry
XML
Extensible Markup Language
Technical characteristics
Security classifications
Citations to governing statutes
This Play guides creating metadata for databases. The provided metadata elaboration approach also applies to describing attributes in Application Program Interfaces (APIs) and other datasets. If your improvement effort includes API-based data-sharing, the supplemental section Describing Application Program Interfaces provides an overview of API standards and development processes to keep your API descriptors current.
The roles and responsibilities required to complete this Play vary by department. For example, the role of your department’s information security team may guide your effort by providing data classification criteria, or they may want to be more directly involved in the effort. Additionally, the staff roles that coordinate with your legal team may vary. A sample of required staff are listed below and depicted in the following diagram:
Information technology (e.g., Database Administrators) creates the baseline list of data elements and their technical characteristics.
Business and data analysts to create business definitions and interpret security classifications, and statute references.
Program staff to provide background and clarifications to create business definitions.
Information security to support creating data classifications.
Access to legal teams to provide guidance on statutes that govern data-sharing. Your department’s staff roles and practices may vary from the list above.
You can use the following approaches to engage the needed teams:
Leverage the executive and team buy-in garnered by completing Play 3: Create a Business Case.
Define a specific scope (e.g., Dataset) and schedule that accommodates staff resource constraints.
Inform participating staff of the benefits for your department’s analytics, information technology, and security teams.
Demonstrate results through an incremental metadata collection effort to sustain support for the effort.
Participating staff and team management may have concerns about impacts on their regular job duties. Jointly develop a schedule with the staff supporting the effort that maintains progress while incorporating the availability of required staff.
With the first dataset selected by department management and stakeholders, Sally starts the effort to expand the Walk to Work (W2W) metadata. Sally meets with Carlos to develop a high- level plan to collect the W2W metadata and identify the staff roles needed for the effort.
Sally meets with her coach, Ann, for advice on engaging these teams in the effort. Ann suggests that Sally ask the W2W program manager to email the teams to engage their support by summarizing the following:
The effort is focused on the W2W data to manage scope.
Specific staff needs and anticipated timeline.
Benefits to the W2W and improved ability for inter-department data-sharing with the Healthy Habits programs.
Benefits to the department.
The approach that incrementally improves metadata based on staff availability.
Sally reviews the notes she and Carlos created during the prioritization effort conducted in Play 4: Prioritize Your Data and the business case created in Play 3: Create a Business Case to summarize the program and department benefits of the effort. She also uses the technical and security benefits from the Guidebook’s supplemental section Benefits to Your Department by Executing the Plays to incentivize CDW team participation.
Sally’s previous work with the CDW program managers and information technology team has established the context for the effort and established relationships to help secure staff resources.
Sally meets with the W2W program manager to explain the requirement for program staff support for this phase of the effort. She requests the assistance of a business analyst to create business definitions and security classifications. Her request also includes access to a program specialist to assist when additional business context is required to create business definitions.
Sally works with CDW executive leadership to send a communication to the CDW information technology and legal departments to secure their support for the effort. Sally drafts an email that includes the points above for transmission by executive management.
Sally will schedule a kickoff meeting to ready the individual team members to review objectives, scope, and the metadata collection process in the Play 6.2 vignette.
With your team assembled, it’s time to start populating your metadata repository created in Play 5: Establish Your Metadata Repository. The diagram on the following page depicts the flow of technical, business, security, and legal metadata collection:
Establish Your Data Element Baseline
The first step is to create your baseline of data elements to later addition of business definitions, security classifications, and statute citations. This serves as your inventory of data elements to enrich with business definitions, security classifications, and statute citations.
If your department has a data catalog tool, you can use features to auto-discover and populate this information. The supplemental section Example Metadata Repository Tools provides an overview of data catalog and metadata repository tools.
If you don’t have a catalog tool, don’t worry. You can extract this information from most database platforms using SQL queries. The vignette in Play 5: Establish Your Metadata Repository provided an example of this approach.
With the baseline list of fields in place, it is time to start creating business definitions.
Create Business Definitions
Understanding the meaning of data elements (e.g., Database Fields) is crucial to accurately consuming data and creating analytics. Misunderstanding data meanings can compromise the results of business rules and calculations. If recipients cannot interpret your data’s meaning, they will need to send clarification inquiries that slow down their analytics efforts and utilize your staff’s time. Business definitions are also required to create security classifications and identify governing statutes.
Field definitions and a supporting business glossary inform data recipients and your internal teams of the meaning of your data. Creating effective data definitions is a vital part of your metadata collection efforts. Your department is investing time and staff resources into the metadata collection effort. To fully realize the benefits of your data catalog, definitions need to be clear and useable to persons not familiar with your department’s unique terms.
Not everyone on your metadata collection team may be familiar with the practice of creating data definitions. For example, program staff may not have previous experience creating data definitions if they are not already incorporated into system design processes. Providing guidance and training to the team promotes consistency of your data definitions.
The Guidebook supplemental section Creating Effective Data Element Definitions provides the following to help your team create effective data definitions:
Data Glossary examples and a sample template.
Characteristics of effective field definitions.
A method to practice and build field definition skills.
An approach to training your team on creating field definitions.
Even if you have previous experience creating field definitions, we recommend reviewing the Creating Effective Data Element Definitions supplemental section as a tool to train your fellow team members.
Evaluate Applicable Data Standards
Using an existing data standard to describe your data improves understanding of data elements; data recipients who are already familiar with a data standard will more quickly be able to interpret shared data. Additionally, incorporating an existing data standard may save time describing your data by leveraging existing descriptions and limiting data definition creation to California program-specific data elements.
Examples of existing data standards are provided in the table below:
Health Care
The USCDI is a standardized set of health data classes and constituent data elements for nationwide, interoperable health information exchange. Provides a set of standard definitions focused on opioid addiction that can be adapted for other types of studies.
General Human Services
Administration for Children, Youth and Families (ACYF)
ACYF is creating a set of data structures with definitions for the programs it administers. The Information Exchange Packets are in the National Information Exchange Format (NIEM) and can be used as a source of definitions.
Data standards are widely available in the health data domain. Other data domains are more limited but are expanding. For example, the ACYF Information Exchange Package Documentation (IEPD) is currently developing draft Exchange Packages that may be available in the future to help describe your data in the future.
Given the benefits of understanding and time savings, it is worth investing time to identify an existing data standard that applies to your programs.
Your department’s programs are likely subject to State and Federal statutes beyond broad- reaching legislation such as the Health Insurance Portability and Accountability Act (HIPAA). Some examples of governing statutes that impact data sharing include the following:
California Welfare Institution Codes (WIC) and Other California Codes
California-Specific Health and Privacy Laws
Federal Code of Federal Regulations (CFR)
The Department of Health Care Services CalAIM Data Sharing Authorization Guidance provides an example of data-sharing guidance incorporating state and federal-level statutes governing data-sharing.
Governing statutes can impact data-sharing, including:
Use of the data
Restrictions on data granularity (e.g., Individual Person Records)
Requirements for enhanced security controls
Early awareness of the relevant statutes mitigates delays during BUCP creation, approval, and fulfillment. For example, detecting governing statutes late in the BUCP process may cause a re- evaluation of security and data usage approvals. A complete list of governing statutes helps address the following BUCP fields:
Creating a Use Case that specifically links data-sharing and program purposes.
Legal Authority for the data provider to share the data and recipients to access data.
Identifying and establishing an agreement to address the contents of the BUCP
A comprehensive list of governing statutes can also address constraints on data-sharing while addressing business objectives. For example, awareness of restrictions on releasing person- level records may help illuminate alternatives, such as the data provider creating aggregated or cohort-level data. A comprehensive list of governing statutes also may help identify applicable statutes affecting linked data combined from multiple programs that have differing governing statutes.
Your information security and legal departments should provide guidance on the applicable statutes and codes that govern data sharing. The Center for Data Insights and Innovations provides publications to assist in the identification of governing statutes and codes, including:
Your metadata repository is a tool that provides visibility of the program-specific statutes and codes that govern requested data.
As data is requested, you can run reports to identify relevant statutes early in the BUCP process to address data-sharing requirements proactively. The list of statutes from your metadata repository helps determine requirements and restrictions for incorporation into the initial BUCP formulation. As noted previously, early awareness also helps gain required legal interpretations in the early phase of the BUCP process and opportunities to identify solutions to data-sharing restrictions.
Your metadata repository created in Play 5: Establish Your Metadata Repository included attributes that create traceability to relevant statutes and codes. You can work with your legal and information security teams to classify data during your metadata collection effort. Be sure to classify data with sufficient specificity to correctly identify governing requirements, including sections, subdivisions, paragraphs, and subparagraphs.
Maintaining data classifications associated with your data elements is an input to identifying restrictions and required security controls when sharing data. As with statute citations, you can run reports from your metadata repository to identify the security classifications of requested data to initiate security approvals and security control identification early in the BUCP process.
The business definitions you previously created provide context to help identify or update classifications for data elements. Work with your information security team to identify the types of security classifications and establish a methodology for your metadata collection team to classify data. One approach is to create a set of evaluations to use for each data element to identify Personally Identifiable Information (PII) and Protected Health Information (PHI). You will want to create data classifications iteratively for each of your data sets and systems.
Some data catalog tools provide suggestions for data classifications based on field names and definitions. These suggestions still require a data security expert to review the data elements.
Your next Play is establishing data management processes to help you maintain your metadata.
Sally schedules a kick-off meeting with the team members collecting and creating the W2W metadata. The team is composed of the following staff:
Carlos, the department's data architect, will coordinate the creation of the baseline of data elements and technical characteristics from the W2W database.
Samantha is one of the business analysts from the W2W program. She will create business definitions and coordinate with legal to identify governing statutes. She will also be supported by Angelica, the W2W program specialist, with definitions that need clarification.
Linda is a CDW data analyst. She works with Samantha to create business definitions. She is also the primary team member creating data classifications using criteria provided by the CDW information security team. As needed Linda confers with the CDW Information Security Officer, to verify the accuracy of data classifications.
During the kick-off, Sally reviewed the same summary of objectives and benefits sent to the team members' managers in the Play 6.1: Secure Needed Staff Resources vignette. She reviews the flow of metadata collection. Carlos will use the W2W database to extract the baseline set of data elements. Samantha will the help of Linda will create business definitions.
As the business definitions are created, Samantha will create legal citations, and Linda will designate data classifications. The team will use communication features in Microsoft Teams and Excel (e.g., Comments, Tasks) to coordinate with one another.
Samantha has not created business definitions before. Linda regularly uses metadata while creating analytics, but she has not created definitions before. To enable the team, Sally schedules a training workshop on creating effective data definitions. She uses the approach provided in the Guidebook’s supplemental section, Creating Effective Data Element Definitions, for staff training.
Carlos starts the effort by having one of his database administrators extract the data elements. The data elements are extracted into an Excel file stored in Microsoft Teams. This process was reviewed in the Play 5: Create Your Metadata Repository vignette.
Samantha and Angelica begin the effort to create business definitions for the data element. The database has some existing definitions that are verified to ensure they are still current. They determine business meaning by:
Previous experience working with the W2W system and analytics.
Analyzing how data is entered into the W2W system’s user interface.
Reviews of design documentation.
Analyzing training documents.
Consulting with the W2W program specialist.
Sally has already established an agreement with the CDW IT team to support the collection of data definitions. Technology staff are available for assistance with identifying how the W2W system uses data elements.
Linda reviews the data elements in the metadata repository and uses the business definitions to designate security classifications. Linda reviews data elements and their business definitions to determine if they contain information including:
Personally Identifiable Information (PII)
Protect Health Information (PHI)
Other Sensitive Information
In parallel, Samantha reviews the data elements for governing statutes. Tagging the data elements helps the CDW identify restrictions or the ability to share certain data with other programs. She reviews the State Health Information Guidance (SHIG) for any relevant guidance. Samantha and Angelica also coordinate with legal to identify governing statutes.
As batches of metadata definitions are fully defined with business definitions and security reviews are complete, Carlos loads the definitions into the CDW database used as a metadata repository. This process was reviewed in the Play 5: Establish Your Metadata Repository vignette.
Your department just invested staff resources to create and populate your metadata repository. To maintain its value and realize your department’s investment it’s important to keep your metadata repository. The best way to keep your metadata repository current is to update it as your systems change.
A good practice is to integrate updating your metadata into your system development processes. This can be accomplished through the following design and development processes:
Establish data element definitions, security classifications, and statute citations during functional design.
Add metadata to your repository as your database or API development team creates system changes.
Verify metadata is in place through peer reviews and/or your development team’s Definition of Done.
Instruct data consumers such as your data analysts to report missing or unclear metadata (e.g., business definitions) to your data management team.
The vignette for this play provides an example of working with your department’s development team to establish processes to capture metadata as systems change.
Sally schedules a retrospective with the metadata collection team to identify ways to improve efforts to expand the information available for additional CDW datasets. Sally is the facilitator, so other team members can focus on providing their perspectives. The key themes identified by the team are:
Collecting metadata for many attributes was initially daunting for the team.
The team had to research data element usage and meaning to create definitions.
Sometimes, the security team was waiting on definitions to create security classifications accurately.
In the second half of the retrospective, Sally asks the team for their thoughts on addressing these challenges. Daniel, a W2W business analyst, frequently had to review the W2W requirements and design documents to create data definitions. He stated that when creating system designs, they have the information needed to define data elements, but it is inaccessible to data recipients.
Daniel’s point about the source of requirements spurs a thought from Andrea, on how to solve the seemingly overwhelming retroactive effort undertaken by the team. Andrea suggests that the CDW modify their system development processes to incrementally define attributes as the department’s system changes. Defining data during system development provides benefits to the CDW, including:
Metadata is defined without research; the information needed is already integral to the design process.
The team can classify data before development; this helps with data-sharing and helps the information security team identify any new security controls.
The effort is incremental to avoid placing a significant effort on the team.
The CDW can integrate this into the development processes for the department’s other systems to start the metadata elaboration effort with little investment.
The retrospective was very effective as it provided insights and opportunities. Andrea volunteers to create a plan on how the CDW can incrementally capture its metadata.
Andrea meets with her team leads to review the findings and recommendations from the metadata collection retrospective. They decide to recommend the following practices:
The CDW business analyst will provide business definitions as part of the system design; this information will now before a design is deemed ready for development.
Database requirements and specifications will include a definition created by the business analyst. The definition is part of the entrance criteria for a requirement or user story (Definition of Ready) before database development begins.
The CDW database team will include the definition when making database structure changes.
The new CDW design, development, and documentation process they will follow is depicted in the graphic below:
The changes to the CDW process avoid the mass metadata collection effort the team conducted in Play 6.2: Collect Your Metadata by incrementally collecting metadata during design and development. This new process saves time since the information to create metadata is already in hand during system design. Additionally, the process creates complete and accurate metadata through a closed loop between design and development.

Establish a prioritization rubric.
Gather information to prioritize data-sharing efforts.
Obtain executive approval to launch data-sharing improvements.
We recommend executing Play 4 in parallel with Play 5: Establish Your Metadata Repository to have capabilities for an immediate launch of Play 6: Describe Your Data after completion of your data prioritization effort.
A data prioritization rubric provides a standard set of characteristics to create consensus among department stakeholders about where to focus data-sharing improvement efforts. In Play 3: Create a Business Case, we recommended obtaining approval from executive management to collaborate with data stakeholders to establish a data prioritization rubric. This approach creates an organizational-level perspective to prioritize your department’s data.
Establishing your prioritization rubric before initiating data prioritization research helps you collect the information needed to rank your department’s datasets during dataset analysis and discovery sessions.
The table below provides sample characteristics to incorporate into your data prioritization rubric. Collaborate with the departmental staff selected to prioritize your department’s data in Play 4.1: Establish a Data Prioritization Rubric to identify additional criteria and rankings. Collaboration improves your rubric and helps establish buy-in during the data prioritization ranking selection conducted later in this Play.
The dataset is provided under a current BUCP or other data-sharing agreement. The dataset is being requested through a BUCP that is under review.
Data recipients will immediately benefit from your enhanced metadata, such as business definitions.
Security classifications and statute citations help address Specialized Security and Privacy fields.
The dataset is commonly requested by other departments. The program supported by the dataset is interconnected with programs in other departments. The program supported by the dataset interconnected with programs within your department. The program supported by the dataset is related to agency-level initiatives.
Indicates future demand to provide the dataset.
Your department heavily uses the dataset in reports and analytics.
The improvements to data-sharing benefits report and analytics creation by your department.
The system that maintains the dataset is a candidate for modernization.
The resulting data architecture created by improved data-sharing supports the Project Approval Lifecycle (PAL) and new system design.
The CalHHS Data Playbook also contains several plays to help you prioritize your data listed below:
Your prioritization criteria will have different levels of importance. For example, a dataset already provided under a BUCP may have more significance than a dataset potentially supplied in the future. Additionally, datasets shared between programs in your department provide a direct return on investment in data sharing.
To help score datasets, you can establish weights to your prioritization criteria. This approach creates a numerical score to help assess data-related priorities.
Consider Creating Data Subsets
Not all the data in a database may be a priority for data sharing. For example, data requestors may only need a portion of the data stored in a database related to participants, programs, and participation. To reduce your data-sharing improvement effort, consider creating curated datasets focused on commonly requested data.
Past BUCPs and other data-sharing agreements are a source to identify specific tables or files to focus your efforts. Review the BUCPs you collected in Play 1: Establish Data-Sharing Metrics and BUCP Tracking to identify data previously requested to identify data subsets.
One option is to create curated datasets to reduce the scope of work while receiving data- sharing benefits. A curated dataset is a collection of datasets that are selected and managed to address specific data consumer needs and business questions. The Medium article The Importance of Data Curation: A Step-by-Step Guide introduces data curation. The supplemental section, Additional Training and Reference Materials references online training materials that provide training on data curation.
After receiving executive approval and launching a parallel effort to create the CDW metadata repository, Sally assembles a working group to create the department’s data prioritization rubric. The department executives selected the following staff members to participate in creating the data prioritization rubric:
Ann represents the Healthy Habits program.
Angelica represents the Walk 2 Work (W2W) program.
Pankaj represents the Your Environment program.
Carly is the CDW Chief Information Officer (CIO).
Danny is the manager of the CDW data analysis unit.
These participants represent a distribution of program, data, and information technology interests and needs.
The working group meets to identify the criteria and weighting to prioritize the department’s data. After the discussion, the group determined that the Play’s example criteria are a good starting point. The group plans to reevaluate the criteria for their effectiveness after prioritizing the CDW’s data.
Next, the working group defines weights for each criterion. They adopt a numeric scale from one to five as weights for the criterion. The weights are then totaled to create a ranking of the priority for each data set. The workgroup creates the following weights:
The W2W and Your Environment programs have plans to share data to identify cross- program impacts. Angelica and Pankaj work with the group. They advocate that datasets used across CDW programs should receive a score of five as the effort directly benefits the department. The workgroup agrees to this weight factor.
The CDW is increasingly receiving data requests from other departments. The group agrees to assign a weight of four if other departments frequently request the dataset.
Carly, the CDW CIO, notes the department has several forthcoming modernization efforts. She requests that datasets created by systems with scheduled modernizations receive a score of three.
The remaining factors will be evaluated during the final decision-making process by executive management.
Sally documents the criteria and weighting factors in the data inventory the team created in Play 2: Identify Your Datasets. During data prioritization analysis, the team will refer to criteria during research and discovery sessions.
Your approach to gathering information to prioritize your data will vary depending on the selected criteria. The list below provides examples based on the example criteria provided in Play 4.1: Establish a Data Prioritization Rubric:
Review program initiatives and strategic plans to identify cross-program relationships. You want to validate prioritization provided by document reviews by interviewing department Executives and Program Managers. Discovery sessions provide an effective mechanism to help further your understanding of priorities and achieve executive buy-in.
Use your BUCP tracking system and repository created in Play 1: Establish Data- Sharing Metrics and BUCP Tracking.
that identifies datasets that are frequently requested or part of a current BUCP.
Review your department’s project portfolio to identify systems that have future modernization efforts.
As you gather information, retain your notes and supporting documents for later reference. Summarize your notes into key points for future reviews by the data prioritization workgroup.
While collecting information on the CDW dataset, Sally took some initial notes to start the prioritization process. These notes are a starting point, but additional information is required.
Sally decides to use discovery sessions with the primary CDW program teams and executives to gather additional information to prioritize the CDW datasets. Sally acts as the facilitator while Carlos takes notes on the meeting. Dividing facilitation and note-taking allows Sally to focus on questions that elaborate additional information. Carlos benefits from note-taking by learning more about the CWD’s programs. She schedules individual discovery sessions with the Walk 2 Work, Healthy Habits, and Your Environment. Sally uses the notes she took during the data inventory effort and program documentation to develop questions that will illuminate the value of program data, including:
The importance of data to the program’s mission.
The relationship of the program to:
The department’s strategic plans.
Other CDW programs.
Other departments and organizations.
The frequency by which data is shared with other departments.
Sally packages the meeting notes and sends them to the respective program teams. This allows the teams to make corrections, ask questions, and further clarify ideas.
Sally then reviews the BUCP tracking repository her team created earlier that year. She runs a report and identifies that the Walk to Work program has received the most data requests. She records this information in the data inventory.
Sally and Carlos met with the CDW Project Management Office to get a list of the department’s forthcoming modernization efforts. The Walk 2 Work system is currently in the California Department of Technology (CDT) Project Approval Lifecycle (PAL) Stage 1 and is scheduled to enter Stage 2 later this fiscal year. Carlos meets with Carly, the CDW CIO, and Andrea, the IT manager. He learns that the improved data dictionary will help with Stage 2 deliverables and be useful for the new system design.
Once you have gathered prioritization information, perform a test of the criterion created in Play
4.1: Establish a Data Prioritization Rubric and the dataset information gathered in Play 4.2: Gather Information to Prioritize Your Data. The test of the criterion identifies potential adjustments to suggest to the stakeholders that approve the data prioritization scoring.
Send the summary of key points from your research to the data prioritization workgroup for review ahead of any meetings. Sending information ahead of meetings ensures participants are informed and prioritization meetings are effective. You may also want to provide access to your detailed notes to give workgroup participants more insights about the findings.
Schedule a meeting with your data prioritization workgroup. Designate a facilitator who will not participate in creating recommendations. Use the criteria and weights to make an initial prioritization ranking. The workgroup can also include qualitative factors in its recommendation to supplement your ranking system.
With the data prioritization recommendation complete, it’s time to present it to executive management. Create a PowerPoint presentation that contains the following information:
Purpose of the data prioritization effort.
Members of the data prioritization workgroup to remind leadership who was allocated to the effort.
Overview of the rubric to provide the basis of the recommendation.
Anticipated data-sharing benefits from the highest priority dataset.
Summary of the data prioritization recommendation.
List of staff resources required to move forward with the effort.
Ask executive leadership to review the data prioritization recommendation and seek their approval to move forward. You may get approval during your review meeting or need to schedule a follow-up to allow time to review the team’s recommendation.
You can start executing Play 5: Establish Your Metadata Repository while executive leadership reviews the data prioritization recommendation and data-sharing improvement request.
Sally and Carlos distribute summaries of their notes to the data prioritization workgroup. They schedule a meeting with sufficient lead time for the workgroup to review notes and ask questions.
During the data prioritization meeting, the workgroup uses the rubric to evaluate each dataset using the criterion and weights to rank the department’s datasets. The weights result in the following dataset priority ranking:
Walk 2 Work
Healthy Habits
Your Environment
The workgroup discusses the agreed-upon criterion to validate that the ranking accurately reflects the department’s priorities. The team documents the recommendation to use the W2W as the first program for data-sharing improvements based on the following findings:
A current BUCP is under review to supply the W2W data to the Department of Mass Transit.
Data sharing with the Healthy Habits program will identify the positive impacts of W2W on physical activity programs.
Other departments frequently request the data.
The resulting data dictionary helps create some of the PAL Stage 2 artifacts including input for Mid-Level Requirements (MLR), reference architecture, and data conversion plan.
Sally schedules a meeting with the data prioritization workgroup and executive management to present the data prioritization recommendations. Sally presents the following to executive leadership:
Overview of the rubric used for data prioritization.
Ranking of the data based on the criterion and weights.
Relationship of the dataset across CDW and CalHHS programs.
Program impacts from data sharing captured during discovery sessions.
After review, the CDW executive management agrees with the workgroup’s recommendation to prioritize data efforts on the W2W program.
With W2W selected as the priority dataset, Sally and her team start to collect detailed metadata to improve data understanding and assist with BUCP agreements.
With your goals and strategy successfully outlined, you can now think about what data or measurements you need to collect to answer your guiding questions, as well as the data you need to determine if you are ready to proceed with data collection. If you’re a manager, you’ll also need to define your outcome measures and performance/self-assessment metrics to maintain the integrity of your project and ensure you’re supporting your team and stakeholders as best you can.
Before proceeding, you should go through a Readiness Checklist to ensure you’ve considered your own strengths, weaknesses, and that of your manager and team. Get the support or learning you need now to prevent misunderstandings or frustrations later in the process.
Ask yourself: Do you have the Support, Knowledge, and Resources to Complete your Project?
Do my managers/directors have the bandwidth to support me?
Do I/my team have enough expertise to complete this project?
Do I have access to the data I need to complete the project?
Do I know the statistical methods required to analyze my data?
Who is my department’s Data Coordinator? (The individual responsible for knowing the data assets held by your department)
Contact [email protected] to find your Departments Data Coordinator
Your program data is the core data of this project — it’s the specific measurements that you need to collect in order to answer the project’s guiding questions. As a review, your guiding questions are the purpose of this project as a whole, and spending some time thinking about your project’s purpose statements will help you determine what data you need and how you should collect it.
Example Purpose Statements:
I need to decide how to allocate resources to different programs based on which is the most successful
I want to improve or refine an existing program or model to be more effective
I want to create product or service that positively impacts a community
I want to look at existing data to find trends and patterns that people care about
It can be useful to review all your data assets with these questions in mind. Contact your department’s data coordinator for more information about the types of program data you collect in your department by emailing [email protected].
Managing a team at CHHS is challenging — in addition to setting and working toward your program goals, you must also assess the performance of your team and support their continuing learning; set the broader goals that guide larger initiatives, programs, or departments; and work toward capacity building in analytics, data literacy/governance, and much more. The following section is written for a wide range of manager roles, including the larger cohort of managers who supervise analysts and technical employees (SSM1s) to the smaller cohort of branch-level directors or managers working on capacity, vision, and strategy of their department.
As a manager, you may be in charge of managing the overall performance and strategy of the project or program; you also may need to assess the performance of the team itself, and the department’s resources. This requires defining and measuring outcome data, monitoring your team’s or program’s performance, and assessing your department’s current data assets and analytic capabilities.
The following section contains a number of frameworks and resources to assess your Team’s Capabilities… …related to projects and programs
Assessing Readiness: considering the scope, risks, limitations of your data project
Measuring Performance: Setting Key Performance Indicators (KPIs) for the project and your team
Determining Outcome Measures: benchmark, baseline, and comparative data …at the department level
Strategic Use of Data: how effectively does the department utilize data to inform decisions and strategy?
Capacity Building: Improving internal capacity, assessing management strategy & organization
Data Governance & Management: Management & Security of Data, Improving Data Literacy, data de-identification guidelines
Before planning your data collection, go through the following readiness checklist to ensure you are capable of successfully carrying out this data project. You should catalog your assets and resources regularly throughout your project to identify areas of weakness or gaps in resources.
How do programs or stakeholders use data currently? What do they do with it? How do they use it to make decisions or produce products for external stakeholders?
What are limits to either the data or the implementation solution?
What are the risks and issues with the current data? What value is not being realized?
Identify the current workflow for collecting, processing, and publishing data. Are there dependencies to collecting, processing, and publishing the data?
Remember, if you do not have the resources you need, you and your team will likely encounter problems in your data project. Address weaknesses early and be on the lookout for areas you can improve throughout your project.
This is the data you need to collect after deploying your product or service to determine whether or not it met your goals and was successful. A useful framework to reference is the Key Performance Indicators (KPIs) framework described here. KPIs measure your performance relative to your goals.
It is imperative for managers to regularly assess and improve how effectively they use their data assets to inform their strategic planning and organizational structure, as well as improve their offered programs and services. We will root our assessment in Harvard’s Strategic Use of Data Self-Assessment Guide, a useful framework for understanding how strategically your department uses data and how to improve. A few examples from the guide:
Effective Budgeting and Financial Planning practices driven by data
Assessing organizational strategy and goal-setting
Measuring accountability at all levels of your team
For managers interested in these types of assessments, check out additional resources on building Capability and Capacity in your department (such as the Analytics Capability Assessment for Human Service Agencies.)
You may also be tasked with assessing the quality of your department’s data management and data governance, or working on capacity-building frameworks to improve data literacy and analysis skills.
Harvard’s Strategic Use of Data Self-Assessment Guide has specific questions to identify where departments can better use data at the organizational and strategic levelHarvard Assessment 1Harvard’s Strategic Use of Data Self-Assessment Guide has specific questions to identify where departments can better use data at the organizational and strategic level
Harvard’s Strategic Use of Data Self-Assessment Guide has specific questions to identify where departments can better use data at the organizational and strategic level


Publishing data on the CalHHS Open Data Portal involves a collaborative multi-step process (see Figure 3: Guidance Summary). In identifying publishable state data, State entities should include analyses from their executive and program staff, data coordinators, PRA officers, data stewards, IT, public information officers, security and privacy officers, and legal counsel.
CalHHS departments and offices vary widely in terms of size, personnel, functions, responsibilities, mission, and data collected and maintained. As such, the identification and prioritization processes may vary across entities. These guidelines serve to provide assistance across a broad spectrum of State entities, with the stipulation that State entities look to their governing laws, rules, regulations, and policies in identifying and making available publishable state data.
Within a CalHHS Department or Office, any number of individuals can and should consider identifying data tables for which they may self-identify as stewards of that data. In addition, subject matter experts and leaders within the Department or Office may also identify data tables that could fulfill strategic needs by sharing on the CalHHS Open Data Portal. After identification, all suggested data tables should be assessed and prioritized
In creating a data catalog for the CalHHS Open Data portal, departments should assess the suggested data tables for value, quality, completeness, and appropriateness in accordance with the definition of publishable state data. High value data are those that can be used to increase the State entity’s accountability and responsiveness, improve public knowledge of the State entity and its operations, further its mission, create economic opportunity, or respond to a need or demand identified after public consultation.
Sections A and B below are neither exhaustive nor applicable to all State entities, but rather serve to provide a framework for identifying potential data tables for publication on the CalHHS Open Data Portal. For each question in Section A, State entities must assess whether the data fall within the definition of publishable state data and respective disclosure considerations.
Departments and offices may already publish a considerable amount of data online; however it may not necessarily be accessible in bulk, or available through machine-readable mechanisms. Reviewing weekly, monthly, or quarterly reports which are frequently accessed by the public, or public-facing applications that allow visitors to search for records, are excellent starting points.
Published reports are often populated with data which is compiled or aggregated from internal systems. For example, a weekly public report may indicate that a department has closed 25 projects in that week. The internal system, which has details of each case, may have additional details which can be made public.
Similar to published reports, trend and statistical analysis is often performed using data from various sources. Those sources can be reviewed for data which can be made public
There are multiple methods by which the public requests data from State entities. For example, some PRA requests may seek to obtain data tables or records which are to be provided in digital format. These requests (particularly repeated requests for the same data table) might be fulfilled by making the data table(s) available on the CalHHS Open Data Portal.
Consider engaging with the public for feedback. Options for obtaining public feedback may include, but are not limited to leveraging existing channels for public engagement and community feedback. Connecting with citizens and developers could ensure that data releases are maximally impactful. In addition, the CalHHS Open Data Portal could provide a mechanism for constituents to request data not yet published.
Website traffic and trends analysis will determine frequently accessed data.
Publishable state data that can be used to increase the covered State entity’s accountability and responsiveness, improve public knowledge of the entity and its operations, further the mission of the entity, create economic opportunity, or respond to a need or demand identified after public consultation.
Publishing aggregated data (statistics, metrics, performance indicators) as well as source data can often help a department advance its strategic mission. In addition, the CalHHS Open Data Portal will serve as a conduit for efficiently sharing information with other departments.
The department or office might be in the forefront of standards for government performance, where exposing the data might cause other State entities to raise their performance.
There may be higher value in the department’s data if synergies exist with federal data efforts.
Publishing such a data table publicly can be a powerful method for fostering productive civic engagement and policy debate.
There may be statutorily required reporting which can be satisfied by publishing data tables, without necessarily producing an additional extensive narrative report. If the data are collected and compiled by the department to fulfill statutory reporting requirements, then the department’s governing laws have already determined that the data are of high value for that department.
Certain government functions may involve multiple departments requiring access to similar data. Making the data available would support administrative simplification and efficiency.
Could the data be used for the creation of novel and useful third-party applications, mobile applications, and services?
Software applications often leverage data from multiple sources to provide value to their customers. Making department data tables available can support the delivery of greater value (and impact) through those applications.
Generally when there is demand outside normal business hours (that is known and quantifiable), such data tables should be ranked, where applicable, as high value.
The data are likely of higher value if it is already apparent that there is a deep impact and interest by the public (e.g., public safety inspection results).
Announcements of progress or success – or reactions to public criticism - can be strongly supported by publishing related data, should it exist.
In identifying data tables, State entities may be concerned that users of the CalHHS Open Data Portal will not understand their data or, if distilled to its most raw form, the data might lose utility. There are no hard and fast rules about what level of detail is sufficiently granular to add value to a government data table. Whenever possible, State entities should resist the temptation to limit data tables to only those the department or office believes might be understood or useful. Entities should be wary of underestimating the users of the CalHHS Open Data Portal. CalHHS S Open Data Portal users may come from a variety of fields and specialties, who can envision a use for the data not anticipated by the state entity. A better practice (as described in the section on Pre-Publication) is for State entities to ensure that the metadata associated with each data table is complete, including comprehensive overview documents describing the data, uniform data collection, data fields, and the suggestion of potential research questions to maximize the usefulness of the data.
When creating a schedule for publication of a particular data table, departments and offices must make an assessment based upon a number of factors. State entities should use the general guidance below (in conjunction with the Data Prioritization Survey) to determine the priority for each data table. Prioritizing initial and ongoing publication will entail balancing high value data with the data tables’ level or readiness for publication. Each State entity shall create and provide schedules prioritizing data publication in accordance with the guidelines set forth herein. Prioritization shall be done in a timely manner, recognizing that it may take time for departments to prepare high quality data (noting that data tables vary in complexity and, as such, can significantly vary in preparation time). Approvals for the prioritization plan and scheduling will come from the department/office executive leadership team.
In prioritizing data for release, therefore, departments and offices must account for time to: identify data, assess and validate the data (i.e., ensure consistency, timeliness, relevance, completeness, and accuracy of the data), ensure completeness of the metadata and data dictionary, prepare visualizations and talking points, and obtain all necessary approvals to publish the data (Figure 4). The can help departments and offices prioritize open data for publishing.
Prior to publishing a data table on the CalHHS Open Data Portal a number of steps must first be completed to ensure a high quality and usable product.
Resource files will be formatted in a machine-readable format. CalHHS Departments and Offices have chosen Comma Separated Values (CSV) as its standard format for publication.
Accompanying the data table will be complete metadata and a data dictionary that provides descriptions and technical notes as necessary for every field in the data table. Departments and Offices are also encouraged to include with each data table one or more visualizations of the data (graphs and/or maps) as well as one or more potential research questions of interest to the Department/Office as a way to encourage public engagement and innovation related to strategic goals.
Each data table, as a part of the approval process, will be reviewed for quality assurance, compliance with the CalHHS Data De-Identification Guidelines, and consistency of the data over time. Please refer to the Data De-Identification Guidelines for more specific information.
When publishing data with suppressed values, use an annotation field (column) in each data table that corresponds to records that have suppressed cells. Additionally, use metadata and documentation to indicates small cell method used (<11, etc.) and consider highlighting and drawing attention to annotated fields.
Value in cell is blank if blank due to “annotation”
“0” in cell if value is 0
Annotation Field:
0 or blank = no annotation or blank
Address standards in published data sets is critical to ensure accuracy, consistency, and interoperability. They allow for a structured framework for data publishers and data consumers to interact with the process in a uniform manner. Requiring uniform data formatting will also improve the dataset concept review process. Datasets must follow these formatting and code standards in before being published to the CalHHS Open Data Portal or a GIS Hub site within CalHHS. If there are existing datasets that do not align to these standards, CDII Open Data staff will work with these Departments on a plan and timeline to update the datasets to follow these standards.
Not all elements are required; however, when a dataset contains address information or any of the other elements identified here, these standards must be adhered to for the dataset to be published.
The publication process, initially, involved the development of an open data portal website that fulfilled all of the requirements of the Department/Office. Considerations included branding, usability, design, accessibility (e.g. Americans with Disabilities Act compliance). Each data table being published on the portal requires appropriate categorization and tags (key words) to provide ease in searching for the data to ensure facility in searching for the data. Furthermore, Departments and Offices may consider for each dataset sharing its publication via social media, a press release or other communication method.
The way data consumers interact with and use the CalHHS Open Data Portal is greatly influenced by the way the data are published. The CalHHS Open Data Portal requires departments and offices to present the data in a machine-readable format (CSV) to enable software tools, applications and systems to process it. However, there are many different types of standardization that can be found within the CalHHS Open Data Portal including: metadata, data dictionary, file naming conventions, demographic categories, and navigational categories and tags. Wherever possible, standards and associated guidelines have been developed to ensure consistency and facilitate automation and reuse of the data.
The portal will support a common and fully described core metadata scheme for each hosted data table and Application Program Interface (API) within the data catalog. API refers to the method of how one software component instructs another software component to interact. The metadata scheme will allow data publishers to classify selected contextual fields or elements within their data table as well as adhere to common Meta attributes that have been identified portal-wide, empowering the data consumers to build automated discovery mechanisms at a granular-level. Using a common metadata taxonomy will allow CalHHS Open Data to convey and increase discoverability of high-value data tables.
Open Data adheres to core components of the Dublin Core standard for metadata (). The ability to search and find information is enhanced by the adherence to metadata standards required with each data table. Metadata includes subject categories and keywords which provide for more precise searching and document management. Adoption of the Dublin Core, together with standards for CalHHS Open Data, maximizes adaptability and interoperability.
The Dublin Core Metadata Initiative (DCMI) is a non-profit organization hosted at the National Library Board of Singapore. Its lists of elements, glossary, and frequently asked questions (FAQs) were last revised in 2005, but an effort to update its User Guide is being developed at the wiki page . CalHHS Open Data uses the current set of elements, which are required to accompany each data table.
CalHHS Open Data serves as a portal to present machine-readable data, so that end-users may process, access, discover, extract and combine data elements to reveal new insights, observations, and utility regarding the data. In furtherance of CalHHS' commitment to high quality, CalHHS Open Data requires departments to submit metadata and supplemental documentation with each data table (e.g., data dictionaries, overview documents, etc.). This ensures data are fully described to maximize the public’s understanding and interpretation of the data and facilitates interoperability.
The CalHHS Open Data Portal supports a model that allows data publishers to identify data tables as belonging to a broad category (e.g., health and human services, public safety, and education). Then, using a schema that includes both standardized and category-specific tags and keywords, the CalHHS Open Data Portal helps data consumers to search and retrieve data tables readily and uniformly.
The CalHHS Open Data Portal supports the following formats:
Tabular Data: Comma Separated Values (CSV), MS Excel file extension (XLS)
Geographic Data: Geospatial data are usually organized as a collection of features that define a layer. Layers can be overlaid on top of one another, allowing visualization of spatial relationships, spatial queries, and analysis. The Open Data Portal supports two data formats for geospatial information (tabular or shapefile). The appropriate format is dependent on the specific characteristics of the underlying geographic data:
Points: Tabular file format or shapefile. Tabular formatting of points requires either columns for latitude and longitude, or complete address information (house number, street, village/town/city, state, and ZIP code) that can be geocoded.
A shapefile is actually a collection of several files with the same file name, but differing extensions. For the CalHHS Open Data Portal, each shapefile should contain (at a minimum) the following files:
.shp: defines the geometry (shapes)
.dbf: defines the attribute table
.prj: projection, ensures the feature locations are accurately rendered on the map
.shx: shape indexing file, for efficient processing
Note: Shapefiles which use projections other than WGS-1984/Web Mercatur will require conversion which may result in a minimal loss of accuracy. In some cases this conversion can be handled by the Open Data Portal; in other cases it must be done by the participating department.
Other supported geospatial formats include Keyhole Markup Language (KML/KMZ).
The CalHHS Open Data Portal supports geocoding services which convert human-readable address information into map coordinates (i.e. latitude and longitude).
Data tables on the CalHHS Open Data Portal must be kept up-to-date. Specific guidance regarding updates will be addressed in technical and working documents as they are developed. Four mechanisms are supported for refreshing a data table.
Replace: All existing records are removed and new records are inserted
Append: New data table records are inserted
Update: Existing records are modified
Delete: Existing records are removed
Each department or office will be responsible for updates to their data tables based on their internal data governance model. Periodic internal review for the participating department or office is highly recommended. The posting frequency for updates is included in the metadata for each data table and indicates how often the data table will be refreshed (e.g., annually, monthly, daily).
While the concept of open data is best suited to tabular and geographic data tables, we anticipate that there may be a desire to access narrative types of content. Currently, if a department or office develops extensive narrative reports about published data, then those reports should be accessed via the department’s website. The department or office may choose to provide a link to the associated published data table on CalHHS Open Data Portal (which departments and offices must keep current). If opportunity arises to provide narrative content on the CalHHS Open Data Portal, all due consideration will be given.
1 = cell suppressed for small numbers
2 = cell suppressed for complementary cell
3 = no data is available
4 = statistically unstable value
5 = incomplete data
City Name
*Spell out City name, no abbreviations.
State
String (2)
CA
State Abbreviation
*Use FIPS standard 2-digit abbreviation
ZIP
String (5)
95814
USPS ZIP Code (5-digit)
ZIP_4
String (10)
0000
USPS Zip+4 code
(4-digit extension, 000 if unknown)
Country
String (2)
US
Country abbreviation
*Use 2-character FIPS standard
County
String (20)
Sacramento
County Name
*Do not include words “County” or “Co.”
County_ FIPS
String (3)
Census Tract
State + County + Tract
2+3+6=11
06067001202
Block Group
State + County + Tract + Block Group
2+3+6+1=12
060670012022
Block
State + County + Tract + Block
MSSA_ID
String (9)
139j
MSSA ID
MSSA_ Name
String (160)
Capitol Park/ Del Paso Heights/ Downtown/ Gardenland/North Sacramento
MSSA Area Name
*Required if MSSA_ID is present
MSSA_ Definition
String (8)
Lines: Shapefile.
Polygons: Shapefile.
Address
String (80)
1215 O St
First address line including number and road information. *Use USPS abbreviation standards.
Address2
String (20)
Suite #1106
Building, suite, etc.
City
String (30)
Sacramento
067
3-digit California FIPS County Code.
*Required when County Name is present.
Latitude
Float
37.2345432
WGS 84 Projection Latitude
Longitude
Float
-121.2345363
WGS 84 Projection Longitude
2+3+6+4=15
060670012022006
Urban
MSSA Area Density Definition (Frontier/Rural/Urban) *Required if MSSA_ID is present
The Publication Scoring Criteria is provided as an example of a method that meets the requirements of Step 3 in the Data Assessment for Public Release Procedure. It is a tool to assess and quantify potential risk for re-identification of de-identified data based on two identification risks: size of potential population and variable specificity. The Publication Scoring Criteria is used to assess the need to suppress small cells as a result of a small numerator, small denominator, or both small numerator and small denominator where a small numerator is less than 11 and a small denominator is less than 20,001. That is why the Publication Scoring Criteria takes into account both numerator (e.g., Events) and denominator (e.g., Geography) variables.
The Publication Scoring Criteria is based on a framework that has been in use by the Illinois Department of Public Health, Illinois Center for Health Statistics. Various other methods have been used to assess risk and the presence of sensitive or small cells. Public health has a long history of public provision of data and many methods have been used. Further discussion of other methods used to assess tables for sensitive or small cells is found in Section 6.3: Assessing Potential Risk.
This section provides a more detailed review of the criteria that make up the Publication Scoring Criteria.
The Events score represents a score for the numerator. The Events category will be scored based on the smallest cell size in the table.
The lowest value for the Events variable (<11 events) which has the highest score (+7) was chosen to be consistent with the Numerator Condition. The Publication Scoring Criteria is used when the Numerator-Denominator Condition is not met.
Therefore, when the Numerator Condition is not met with respect to the Events variable, a high score is given.
Sex is commonly represented as two categories: male and female. Because the number of categories is small, just knowing a person’s reported sex is not enough to pose a risk of identifying that person. The score of +1 reflects that inclusion of the variable in a table introduces increased specificity; however, that it only has two potential values gives it a low risk.
In cases where an additional stratification of other/unknown is used for sex, the reviewer will need to assess potential for increased risk based on the inclusion of the additional stratification.
Although the variable “Sex” is often called “Gender”, it should not be confused with the variables “sexual orientation” and “gender identity.” According to definitions from the American Psychological Association, “Sexual orientation refers to the sex of those to whom one is sexually and romantically attracted” and “Gender identity refers to “one’s sense of oneself as male, female, or transgender.” 15
Additional information is provided from San Francisco County on their website on the page "".
Age ranges receive a higher score for smaller ranges of years due to the increased risk for identification.
Of note, the HIPAA Safe Harbor method specifically identifies the following as an identifier: “All elements of dates (except year) for dates that are directly related to an individual, including birth date, admission date, discharge date, death date, and all ages over 89 and all elements of dates (including year) indicative of such age, except that such ages and elements may be aggregated into a single category of age 90 or older.” Although dates are included in the Safe Harbor list, age (<90 years old) is not. The risk score to age ranges reflects the two components of the scoring criteria: size of the potential population and the variable specificity.
Race and Ethnicity are collected in a number of different ways on the different state and federal data collection tools. At the federal level, starting in 1997, Office of Management and Budget required federal agencies to use a minimum of five race categories:
White,
Black or African American,
American Indian or Alaska Native,
Asian, and
Ethnicity asks individuals if they are Hispanic or Latino. Additional specificity for Ethnicity may be requested.
The California population in general is approximately:
40% White
13% Asian
6% Black or African American
<1% American Indian
Based on these percentages, Race Group at the level of White, Asian and Black or African American is given a score of +2 because the Asian and Black or African American groups are relatively small. If the reporting is for the OMB standard categories, White, Asian, Black or African American, American Indian or Alaska Native, Native Hawaiian or Other Pacific Islander, and Mixed, then the score is +3. If more specificity is requested for Race Groups the score is +4 because the other groups are much smaller at less than 1% of the overall population. Similarly, for the Hispanic or Latino Ethnicity the score is a +2 for a yes or no answer, whereas more detailed ethnicity results in a higher score of +4.
For Race/Ethnicity Combined fields, the scoring is +2 for the groups White, Asian, Black or African American, Hispanic or Latino. The score is +3 for the OMB standard categories with Hispanic or Latino, White, Asian, Black or African American, American Indian or Alaska Native, Native Hawaiian or Other Pacific Islander, and Mixed. The score is +4 for more detailed categories.
Race and Ethnicity demographics may vary significantly based on geography as well as based on particular conditions. So although the scoring criteria presents a guideline for assessing risk, the population frequencies for the specific geography and/or condition should also be taken into account. Appendix C provides the county specific demographics produced by Department of Finance for reference.
Three scenarios are presented to help demonstrate how to use the three race group and ethnicity scoring criteria.
Complete Cross-Tabulation between Race and Ethnicity Consider this table:
This is the most granular you can get, so you would add both the Race and Ethnicity score to the overall total for your scoring metric (i.e. greatest risk for re- identification). Note that you can replace “Ethnicity” with “Sex” and the principle still applies—you have a cross-tabulated table of Race and Sex.
Race and Ethnicity merged into exclusive categories
Usually the algorithm is that Ethnicity trumps Race when categorizing. This results in a Hispanic category, with the other categories effectively becoming “Non-Hispanic Race.” So the above table would become:
Black 250
White 1000
Asian 95
Hispanic 255
This is when you would use the combined Race/Ethnicity score in the guidelines for your scoring metric.
Third Scenario – No Interaction between Race and Ethnicity If you did this, the above table would become:
Black 300
White 1200
Asian 100
Hispanic 255
Note that this is the only scenario where you can’t add up all the categories to get a total population. Also you would need to run the scoring metric separately for your Race-only and Ethnicity-only datasets. Like the First Scenario, you can replace Ethnicity with Sex and it still makes sense—you now have two tables, one displaying Race and the other Sex, with no interaction between the two—which lessens the Small Cell Size problem.
Language spoken is captured in a variety of data systems to support individuals in receiving services in the language they speak. The following table is taken from the report: . This frequency distribution was used to determine the groupings for the scoring above.
Based on the above numbers, the majority of individuals speak English or Spanish. Therefore if the table includes “English”, “Spanish”, and “Other Language” as the categories for “Language Spoken”, then the score is +2 which is comparable to reporting Hispanic or Latino Ethnicity as a “Yes or No”.
As noted for Race and Ethnicity demographics, language spoken demographics may vary significantly based on geography as well as based on particular conditions. So although the scoring criteria presents a guideline for assessing risk, the population frequencies for the specific geography and/or condition should also be taken into account.
If more specificity for Language Spoken is being requested with respect to reporting on the other languages in the table above, the request will need to be reviewed on a case by case basis. The additional review is necessary given the variability of language spoken by different populations or geographies and the consideration for potential increased risk of identification.
Many reports are published based on the calendar year. However, the combination of years of data is an excellent way to provide increased aggregation in a way that allows for more specificity elsewhere, such as county identifiers. Inversely, the smaller the time period in the data, the closer the time period comes to approximating a date. Thus monthly reported data has a high score of +5.
Of note, the HIPAA Safe Harbor method list includes “All elements of dates (except year) for dates that are directly related to an individual, including birth date, admission date, discharge date, death date, and all ages over 89 and all elements of dates (including year) indicative of such age, except that such ages and elements may be aggregated into a single category of age 90 or older.” This is a potential identifier when in combination with other information. This potential as an identifier influences the higher scores in the Publication Scoring Criteria as the time period for aggregation gets smaller.
The “0” value for this variable is set at one year as this is the criteria for Safe Harbor under the HIPAA de-identification standard.
* If the geography of the reporting is based on the residence of the individual, use the “Residence Geography”. If the geography of the reporting is based on the location of service, use the “Service Geography”.
The Geography score, while it may or may not represent the denominator of the table, does provide a reference to the base population about which the reporting is occurring. This will often be reflected in the title of the table if a statewide table.
Otherwise the geography may be represented in the rows or columns. There are two different scoring sets based on whether the geography reporting is based on the residence of the individual to which the information applies or to the service location.
The scores are higher for geography related to residence address because so much information is publicly available about individuals and their address of residence.
For large populations greater than 560,000, which is equivalent to the size of a state, there is a negative score because the size of the denominator masks the individual. The number 560,000 was chosen as a cut-off because this is the size of the smallest state (Wyoming). We chose to use the cut-off at the smallest state’s population because state level reporting is not listed as one of the 18 identifiers the HIPAA Safe Harbor method.
The scores for the service geography are lower because clients can generally come from diverse locations for services. Although people often seek services or have health conditions close to their homes, they may also travel extensive distances.
Reviewers do need to make sure that there are not constraints associated with services that would mean the service geography and resident geography are the same. For example, if a program publishes service utilization by county and the county services can only be used by county residents, then the service utilization by county is also the county of residence. Scoring should be based on the criteria that results in the highest score and thus the highest risk.
Service Geography includes a level of detail that is identified as “Address (Street and ZIP).” This deals with reporting by provider (hospital, clinic, provider office, etc.) Provider addresses are public information and are public at the street address level. A given provider will tend to have a standard catchment area or the geographic boundaries from which most patients come from. This information is published by Office of Statewide Health Planning and Development (OSHPD) for hospitals.
While this addresses where most patients or clients come from, patients or clients may also come from outside the catchment area. For that reason this does not score as high as the more detailed geography under Residence Geography.
This criteria specifically addresses the interaction of the variables in a given data presentation and requires the analyst to identify dependent as opposed to independent variables. This criteria is used with respect to dependent variables. This is demonstrated in the two tables below.
Illustration A: Dependent Variables
In this example the Event (counts of Disease A) is shown for Males who are also 0- 17 years old or Males who are also 18-25 years old. In this case Sex and Age are dependent because the stratification for each variable is stacked. This commonly occurs in pivot tables.
Illustration B: Independent Variables
In this example the Event (counts of Disease A) is for Males or Females which is shown side by side to a table with ages 0-17 years old or 18-25 years old. In this case Sex and Age are independent because the stratification for each variable is not stacked. Although the two variables Sex and Age are shown in the same table, they are presented independently of each other. While you can compile the data in Example B from Example A, the reverse is not true.
This criteria is structured to have less impact if personal characteristics outside of time and geography are excluded and more impact if multiple personal characteristics are included. This provides for a subtraction of points if the only variables presented are the events (numerator), time and geography and an addition of points for including more variables in a given presentation. With respect to the subtraction of points, the score is based on the minimum value for the Events variable. For example, if the smallest value for the Events is 5 or more, then the score would be -5. However, if the smallest value for the Events is 2, then the score would be 0.
The minimum value for Events of 3 (Only Events (minimum of 3), Time, and Geography (Residence or Service)) is used as a threshold to address concern for pre-existing knowledge by users about individuals. For example, if an entity knows who one person is with disease A and the count for Events is “1” or “2”, then the entity could identify the person they know of or the person they know of plus information about the other person. The use of a minimum of 3 does not protect against two entities colluding to determine a third person. For this reason, the threshold of 5 for Events is also given. The threshold of 5 is frequently used in public health reporting regarding various events.
In contrast, if additional demographic variables are added, then the risk increases significantly. For example, for Events, Time and Geography (Residence or Service) with three additional variables, a table would show how many individuals are female by age group by race for a given time period and geography. This allows for a more detailed comparison to census data and assessment of the number of individuals with a particular set of characteristics. For this reason, additional points are added because of the inclusion of multiple dependent variables.
Variables other than those specified in the Publication Scoring Criteria can be released only after an additional review by the department’s Statistical Expert on a case by case basis. A guideline that can be considered in performing this review is the following scoring.
Considerations include not just the number of groups, but also the characteristics of the variables. Consider whether the variable represents an aggregation (Diagnosis Related Groups) or a specific item (ICD-10 Code). Also consider the availability of the variable to the public when also associated with other information, in particular with variables that may be personal characteristics.
Detailed ethnicity
+4
Race/Ethnicity Combined
This applies when race and ethnicity are collected in a single data field
White, Asian, Black or African American, Hispanic or Latino
+2
White, Asian, Black or African American, Hispanic or Latino, American Indian or Alaska Native, Native Hawaiian or Other Pacific Islander, Mixed
+3
Detailed Race/Ethnicity
+4
37% Hispanic or Latino
Total
255
1345
1600
Cantonese
85,750
1.09
Armenian
65,096
0.83
Russian
41,252
0.53
Tagalog
39,361
0.5
Mandarin
35,330
0.45
Hmong
33,594
0.43
Korean
27,814
0.35
Farsi
26,123
0.33
Arabic
23,929
0.31
Cambodian
20,476
0.26
Lao
8,355
0.11
Other Chinese
7,483
0.1
Mien
3,803
0.05
Sign Language
2,637
0.03
Thai
1,940
0.02
Portuguese
1,666
0.02
Ilocano
1,661
0.02
Samoan
1,306
0.02
Japanese
1,215
0.02
French
653
0.01
Turkish
376
0
Hebrew
367
0
Polish
275
0
Italian
252
0
Other and unspecified
287,201
3.67
Quarterly
+4
Monthly
+5
Population 100,000 - 250,000
+1
Population 50,001 - 100,000
+3
Population 20,001 - 50,000
+4
Population ≤ 20,000
+5
Service Geography*
State or geography with population >2,000,000
-5
Population 1,000,001 - 2,000,000
-4
Population 560,001 - 1,000,000
-3
Population 250,000 - 560,000
-1
Population of reporting region 20,001 - 250,000
0
Population of reporting region ≤20,000
+1
Address (Street and ZIP)
+3
Events, Time, and Geography (Residence or Service) + 2 variables
+2
Events, Time, and Geography (Residence or Service) + 3 variables
+3
Events
1000+ events in a specified population
+2
100-999 events
+3
11-99 events
+5
<11 events
Sex
Male or Female
+1
Age Range
>10-year age range
+2
6-10 year age range
+3
3-5 year age range
+5
1-2 year age range
Race Group
White, Asian, Black or African American
+2
White, Asian, Black or African American, American Indian or Alaska Native, Native Hawaiian or Other Pacific Islander, Mixed
+3
Detailed Race
+4
Ethnicity
Hispanic or Latino - yes or no
Black
50
250
300
White
200
1000
1200
Asian
5
95
Language Spoken
English, Spanish, Other Language
+2
Detailed Language
+4
Total
7,835,022
100
English
4,135,060
52.78
Spanish
2,840,758
36.26
Vietnamese
141,289
Time – Reporting Period
5 years aggregated
-5
2-4 years aggregated
-3
1 year (e.g., 2001)
0
Bi-Annual
Residence Geography*
State or geography with population >2,000,000
-5
Population 1,000,001 - 2,000,000
-3
Population 560,001 - 1,000,000
-1
Population 250,000 - 560,000
Variable Interactions
Only Events (minimum of 5), Time, and Geography (Residence or Service)
-5
Only Events (minimum of 3), Time, and Geography (Residence or Service)
-3
Only Events (no minimum), Time, and Geography (Residence or Service)
0
Events, Time, and Geography (Residence or Service) + 1 variable
Year 1
6
10
5
8
Year 2
8
14
3
Year 1
16
13
11
18
Year 2
22
23
11
34
Other Variables
<5 groups or categories
+3
5-9 groups
+5
10+ groups
+7
+7
+7
+2
100
1.8
+3
0
+1
20